Recently the State of Washington released up-to-date data on Electric Vehicles registered in the state. The dataset was published on January 19 on the Washington State Open Data Portal (data.wa.gov) and it gives us a very detailed view into EV penetration in WA.
The data analysis team at BestBrokers imported the CSV dataset into a relational SQL database, which let us run queries and pull aggregations on it. This allowed us do some nice visual breakdowns as follows:
There are a total of 166,800 EVs, registered in Washington State as of January 19, 2024. When we look at the breakdown of these vehicles based on the type of EV (the fully-electric BEVs vs Plugin Hybrid EVs) we get the following breakdown:
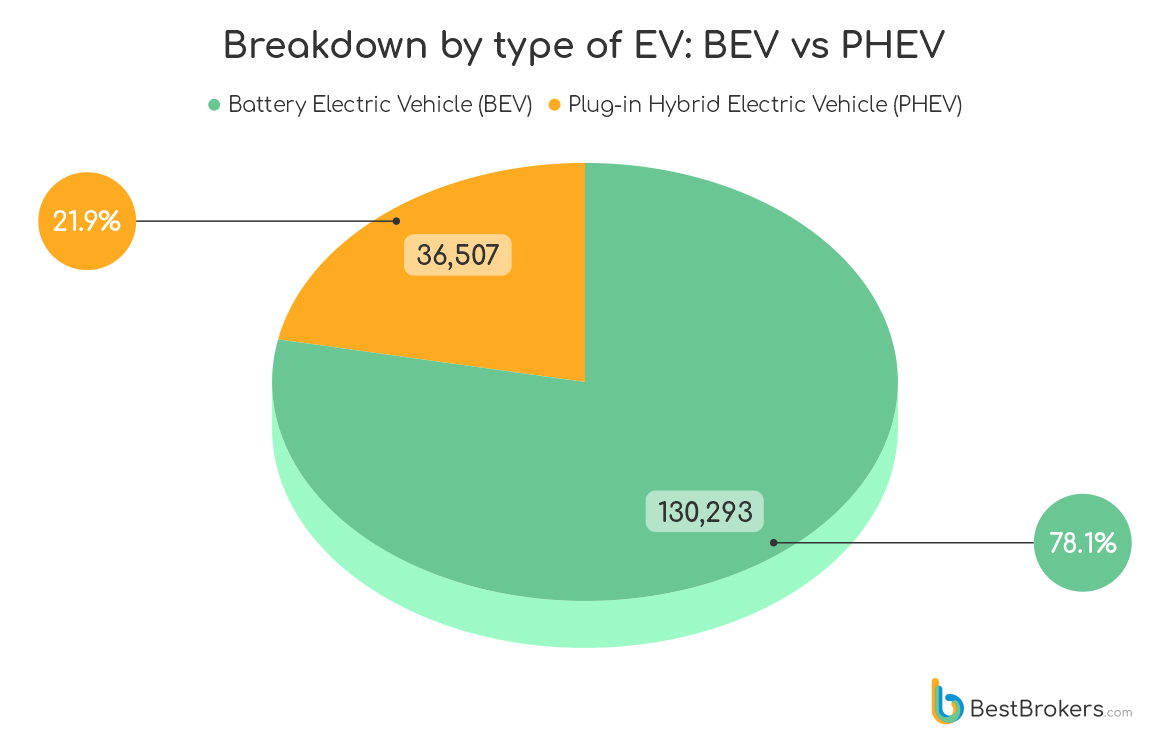
78.1% of all EVs in Washington State are BEVs (Battery EVs), while 21.9% are PHEVs (Plug-in Hybrid Electric Vehicles).
The dataset, containing info about the EVs make and model gave us the ability to do breakdowns by the automaker. When we look strictly at BEVs this is how this breakdown looks like:
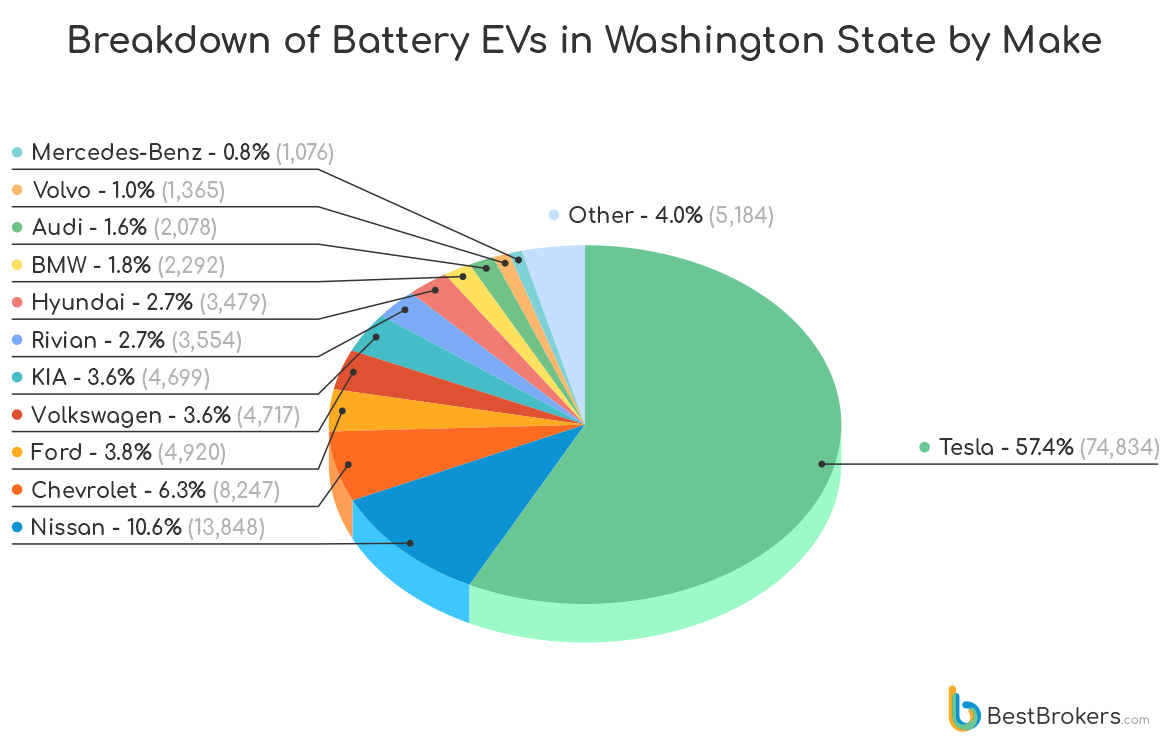
Tesla is the undisputed leader with 57.4% of all Battery EVs. Nissan at the number 2 spot is left far behind at a share of 10.6%.
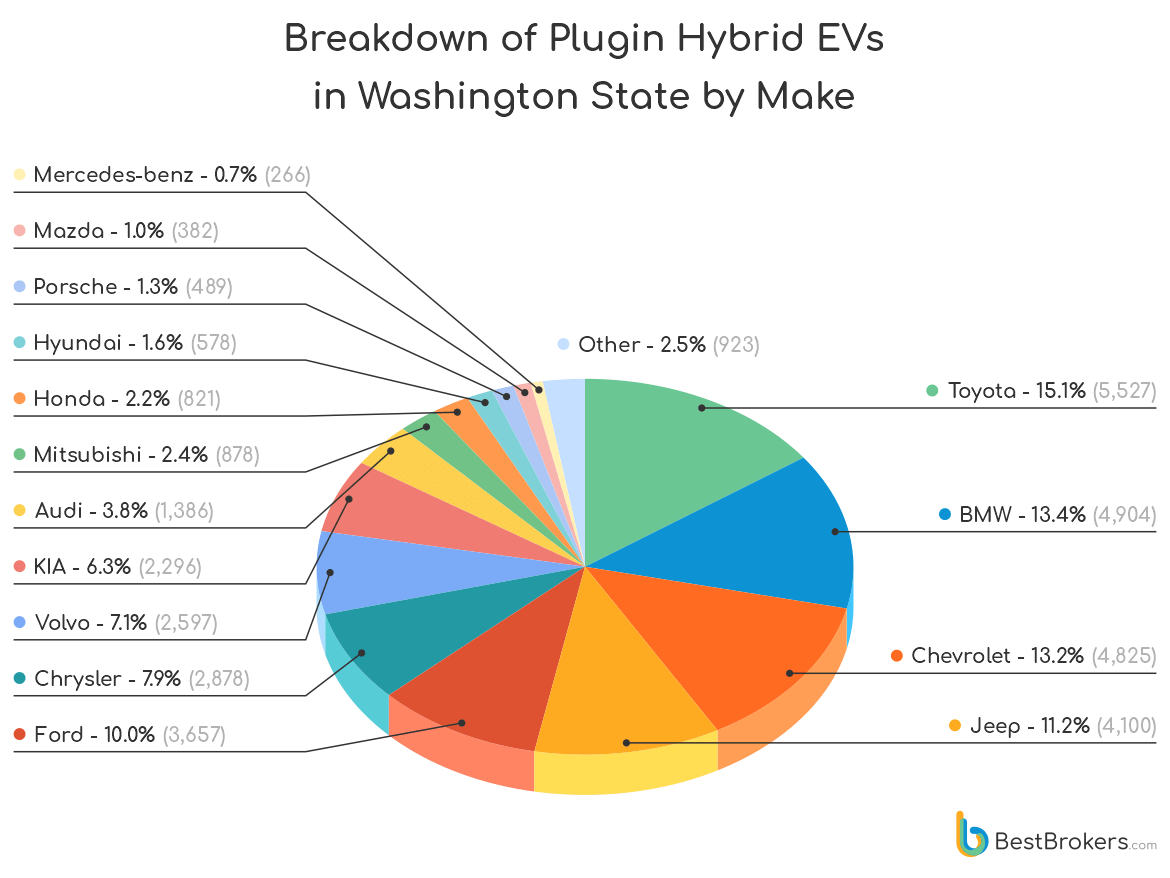
When we look at the Plugin Hybrid Electric Vehicles (PHEV), the picture does change a lot as Tesla does not produce this type of vehicle at all. The absence of the undisputed leader leaves us with a much more balanced breakdown, where the first 4 automakers have a combined share of 52.9%, which is lower than Tesla’s share in the BEV breakdown:
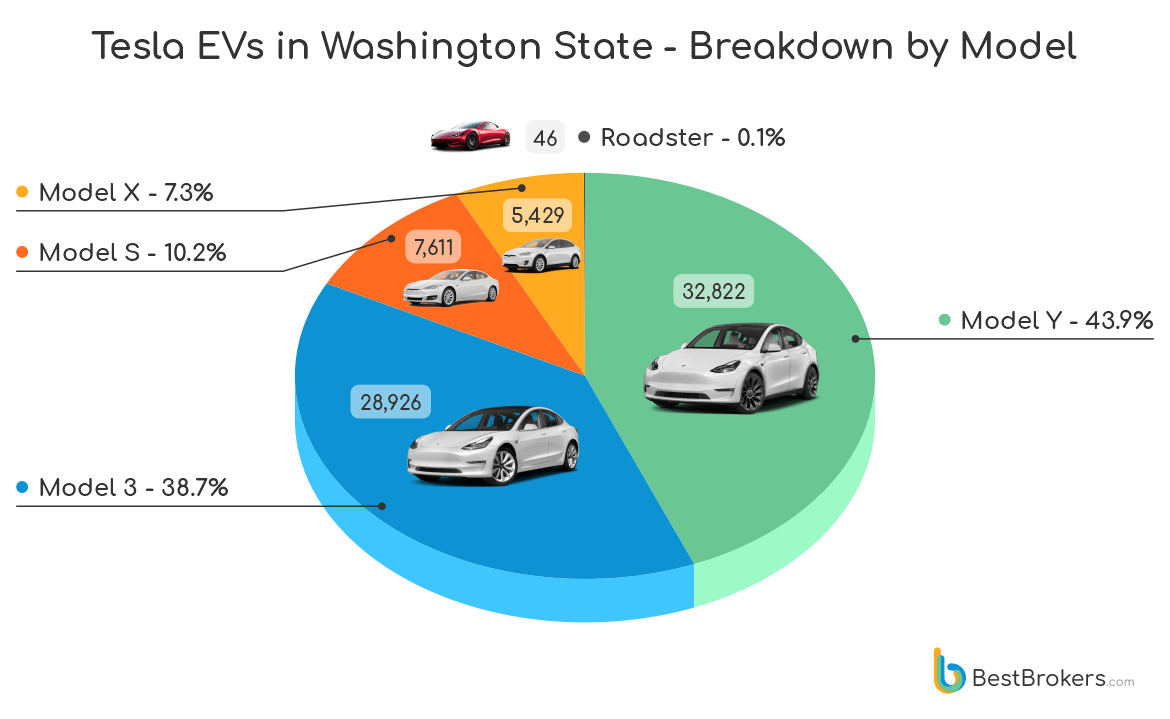
Tesla’s strong leadership in the BEV market made us wonder how the different Tesla models contribute to their lion’s share. This is how this breakdown looks like:
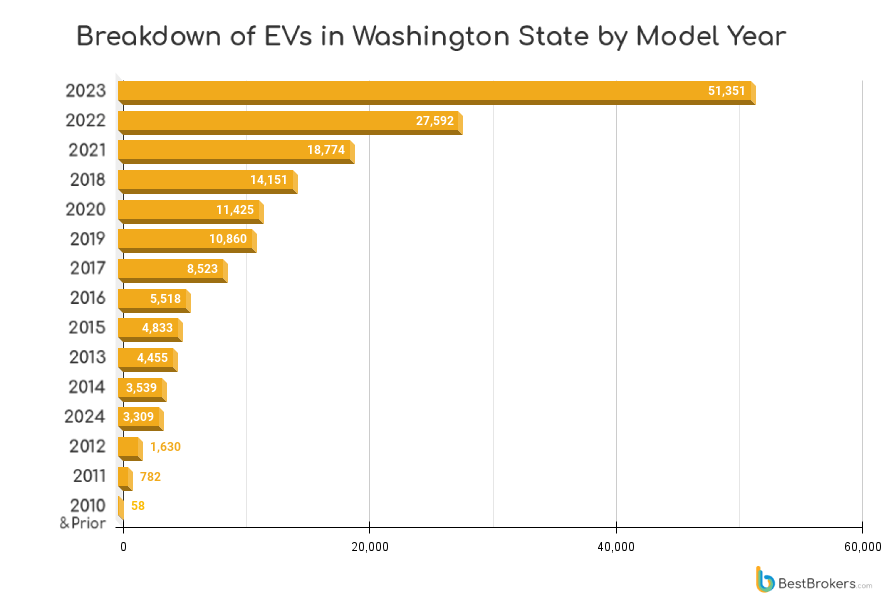
The complexity of the published data gave us the ability to do another interesting breakdown, based on the model year. We can see that 30.8% of all EVs registered in Washington State have a model year of 2023. This means EV registrations in 2023 jumped significantly.
