
Today’s homebuyers might find it hard to believe that back in the late 1960s a house in the United Kingdom could cost less than £4,000. Yet, for the Silent Generation (born between 1928 and 1945) and the Baby Boomers (1946-1964), this was simply a fact of life.
To understand how housing affordability has changed since then and identify the best and worst years to buy a home in the UK, the team at BestBrokers analysed 57 years of data on average home prices from the HM Land Registry and median annual earnings from the Office for National Statistics. Our research shows that Millennials (born 1981-1996) and Gen Z (born 1997-2012) now need about twice as many years of earnings compared to previous generations to buy a home, highlighting a widening gap in affordability over time.
Here’s a detailed overview of how average home prices in the UK have changed in relation to the median annual earnings of full-time employees over nearly six decades:
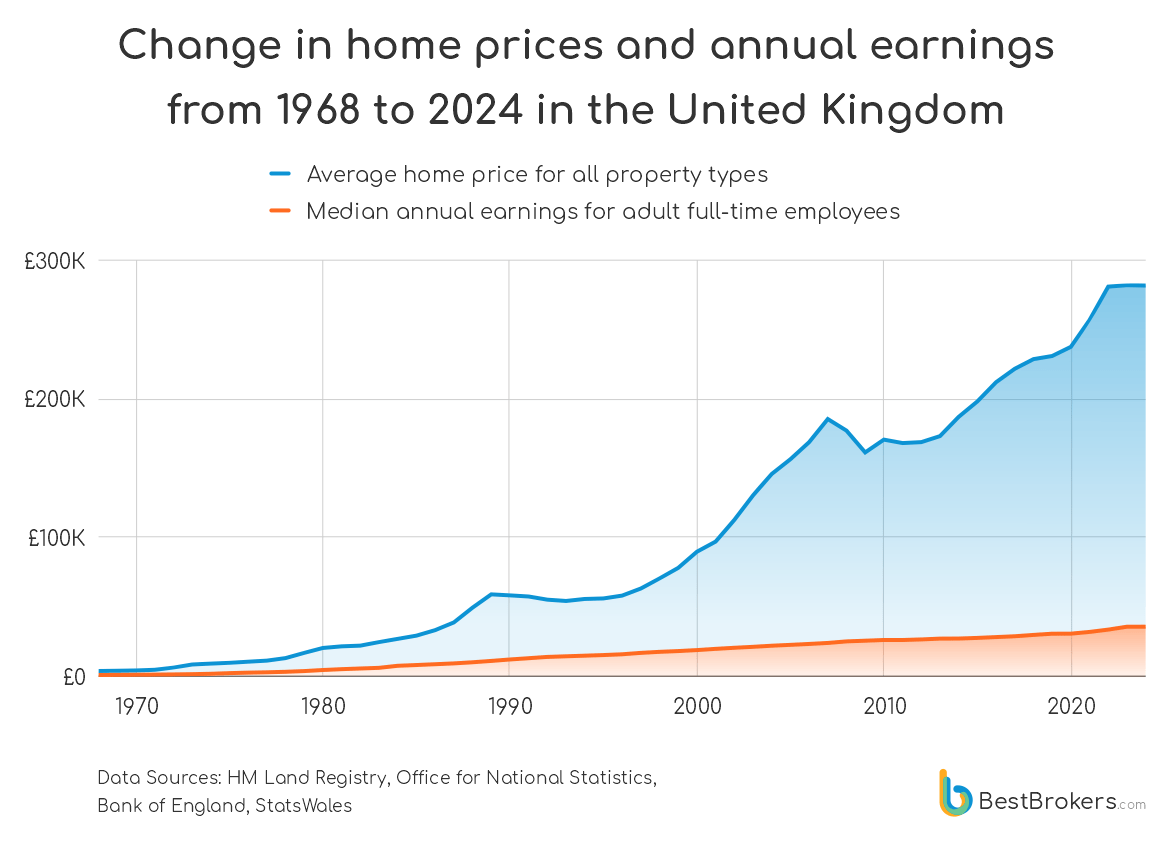
Over the past 57 years, housing prices in the UK have surged dramatically from £3,669 in 1968 to £281,384.33 in 2024, representing a staggering increase of nearly 77 times. This upward trend has been almost uninterrupted, save for a few dips during economic downturns such as the early 1990s recession and the global financial crisis of 2008.
During this period, median annual earnings for UK full-time workers have also shown significant growth, albeit at a slower pace. Starting at £792.59 in 1968, the annual pay climbed to £35,585.79 in 2024, marking a 45-fold increase. However, this wage growth has lagged behind the rapid rise in housing costs, widening the affordability gap as indicated by the home price-to-earnings ratio.
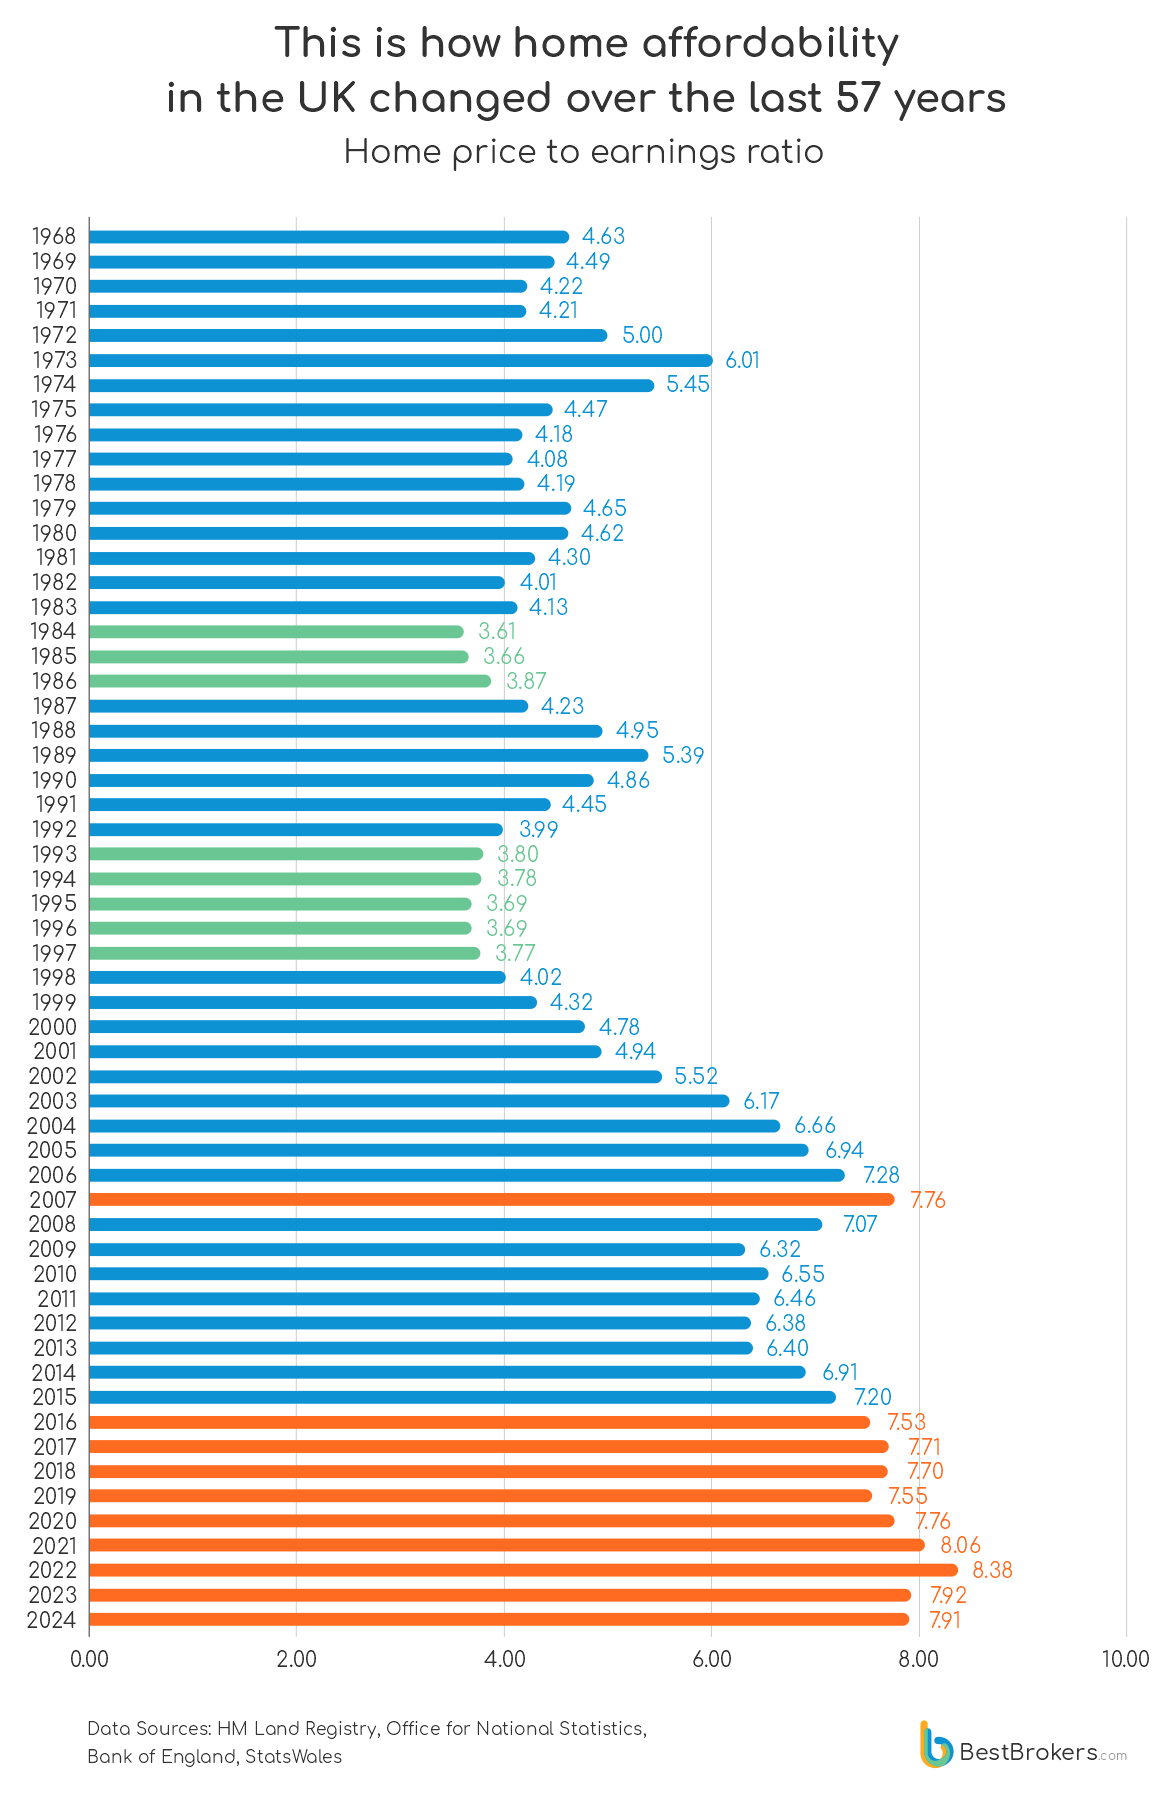
In the late 1960s and early 1970s, homes in the UK could typically be purchased for less than five times the average annual earnings. By 2024, this ratio had nearly doubled, with prospective homebuyers needing approximately eight times their earnings to afford a house, highlighting the growing difficulty for new generations to enter the housing market.
In 2023, the average home price in the UK peaked at £281,645.67, marking its highest level in the past 57 years. However, by the first quarter of 2024, this average had slightly decreased to £281,384.33, suggesting a potential downturn in prices.
Notable Shifts in Home Prices and Earnings Since 1968
In the early 1970s, home prices experienced their most significant year-over-year increase, surging by 37.57% from £6,067.25 in 1972 to £8,347 in 1973. Meanwhile, wages of UK workers saw their most substantial growth in 1975, leaping by 28.93% from £1,651.97 to £2,129.93. In the mid-1970s, the Bank of England’s interest rates stood at 11.25%, peaking at 17% by the end of the decade to combat inflation.
The global financial crisis of 2008 brought about the largest annual decline in home prices, falling by 8.88% from £176,852.75 in 2008 to £161,147.92 in 2009. The Bank of England responded with drastic rate cuts, lowering the rate to 0.5% to stimulate the economy and the housing market. The only decrease in earnings since 1968 occurred in 2011, with a slight drop of 0.04% year-over-year.
During the COVID-19 pandemic in 2020, the Bank of England slashed interest rates to a historic low of 0.1%. By the end of 2022, rates had rebounded to 3.5% as part of efforts to manage inflation. Currently, rates stand at 5.25%, with expectations of cuts later this year.
The Most and Least Affordable Years for UK Homebuyers Over Nearly Six Decades
In 1968, UK full-time employees earned £15.19 per week, equating to £792.59 annually. Back then, the average home was priced at £3,669, requiring just over four-and-a-half years’ earnings to afford.
Fast forward to 2024, and the housing landscape has dramatically changed. The average home price has soared to £281,384.33, making homeownership a daunting prospect for today’s homebuyers, particularly Millennials and Gen Z. With median annual earnings now at £35,585.79, nearly eight years’ worth of earnings would now be necessary to purchase a home, highlighting a significant affordability gap compared to previous generations.
The most favourable period for prospective homebuyers in the UK was over four decades ago. In 1984, the average home price stood at £26,807.25, with median annual earnings at £7,425.01, resulting in a home price-to-earnings ratio of just 3.61, the lowest in 57 years. The following year, 1985, was nearly as affordable, with a ratio of 3.66. The early 1990s recession briefly lowered house prices while earnings continued to rise, offering a brief window of affordability. However, prices began to outpace wage growth again in the late 1990s.
Conversely, recent years have proven to be the least affordable for UK homebuyers. By 2022, the average home price had surged to £280,603.58, pushing the home price-to-earnings ratio to its highest level since 1968 at 8.38. Interestingly, in 2020, the same ratio stood at 7.76, a level also seen in 2007.
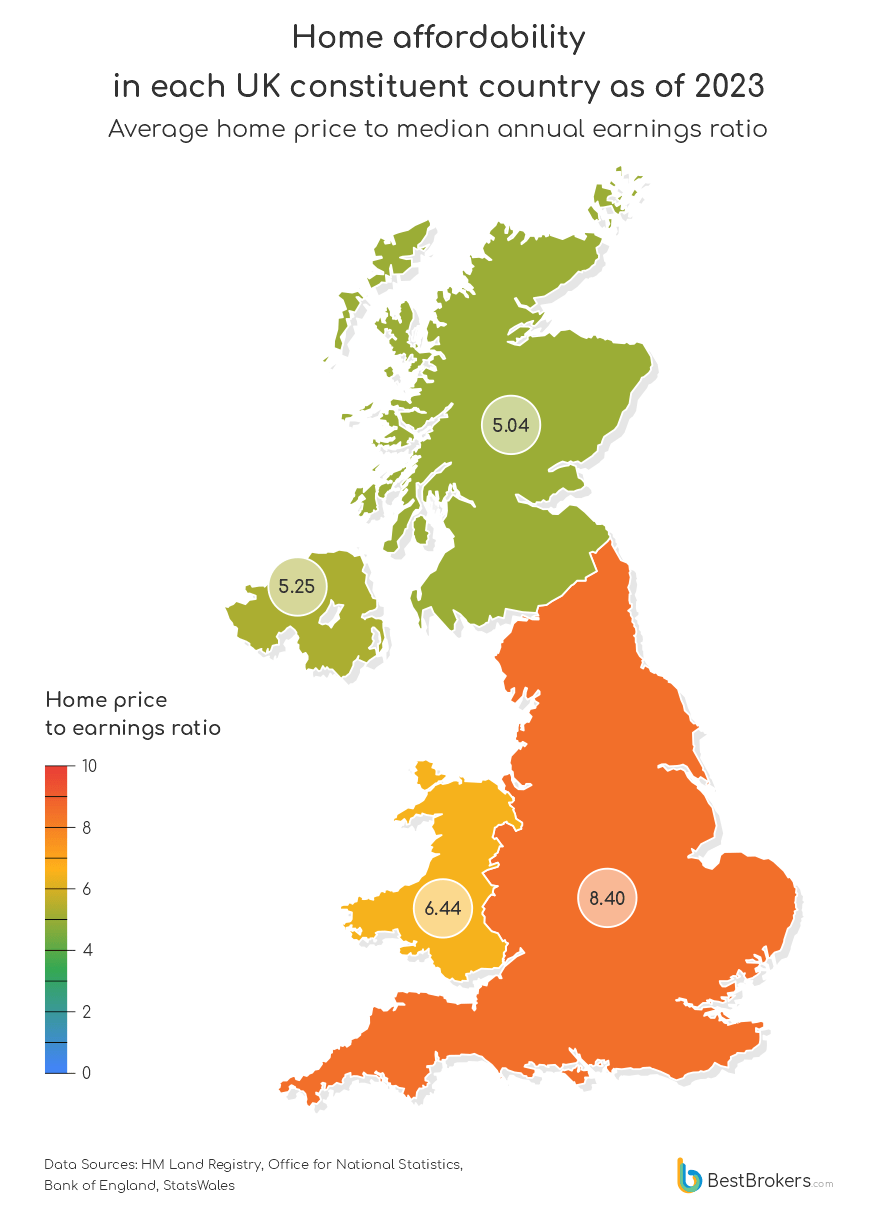
Despite the overall trend of worsening affordability, some UK countries offer more accessible housing options than others when comparing home prices to annual pay.
As of 2023, Scotland had the most affordable homes, with an average house price-to-earnings ratio of 5.04. Northern Ireland also appeared budget-friendly, featuring a ratio of 5.25. Wales ranked next, registering a significant ratio of 6.44, while England showcased the lowest levels of home affordability, with properties priced at 8.40 times the median annual earnings.
27 Years of Housing Affordability Across Every UK Constituent Country
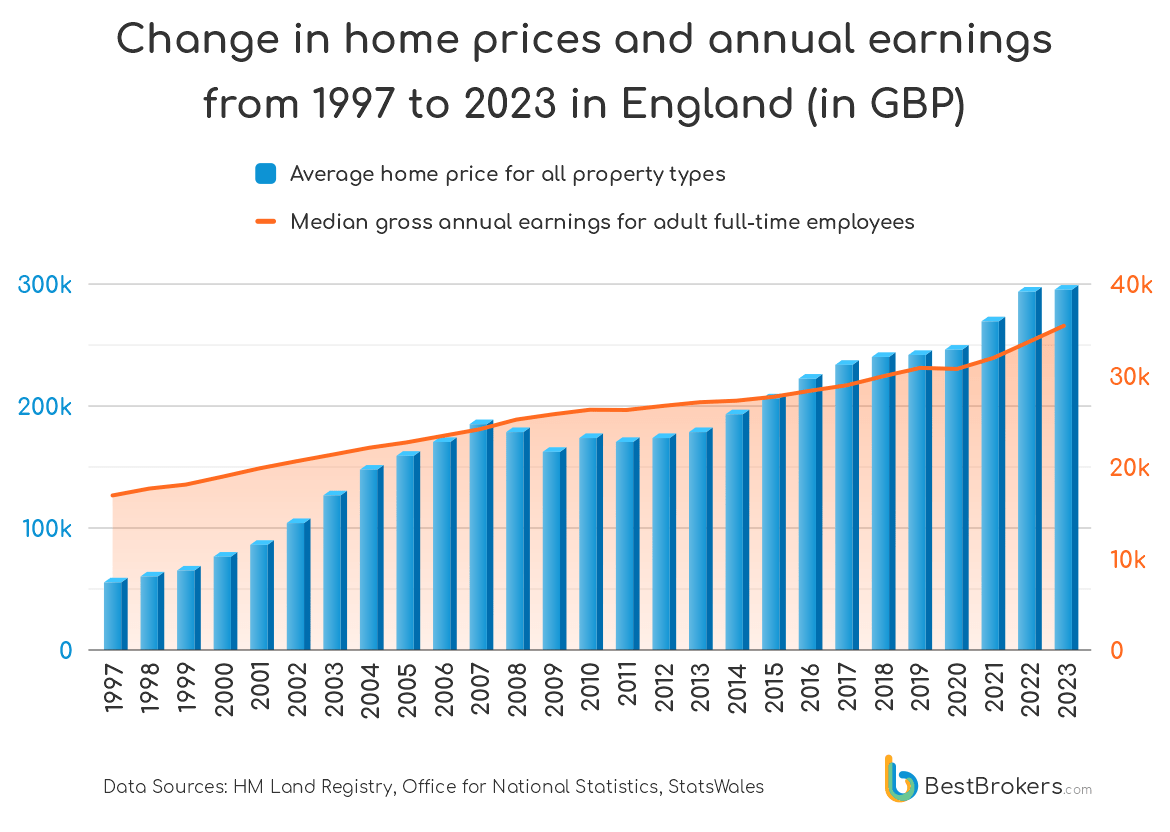
In England, rapid urbanisation, particularly in cities like London, has significantly driven up home prices over the years. The high demand for housing, coupled with limited supply, has made affordability a critical issue, hindering new buyers from entering the market.
Over the past 27 years, average housing costs in England have soared from £59,160.67 in 1997 to £299,648.25 in 2023, marking a substantial increase of 406.50%. Annual fluctuations in home prices have varied, with notable peaks such as a 20.59% rise in 2003, as well as drops like the 8.67% decline observed during the economic downturn in 2009.
Median annual earnings have also shown steady growth, albeit at a slower pace compared to home prices. Starting at £16,958.04 in 1997, earnings climbed to £35,664.05 by 2023, reflecting a 110.31% increase over the period.
In 1997, the home price-to-income ratio stood at 3.49, indicating homes were the most affordable relative to earnings. By 2023, this ratio had climbed to 8.40, slightly lower than its peak of 8.84 in 2022.
| Home affordability in England 1997-2023, Full Data | |||||||
|---|---|---|---|---|---|---|---|
| Country | Year | Average home price | YoY Home price change | Median weekly earings (gross, all adults) | Median annual earnings (gross, all adults) | YoY Earnings change | Home price-to-earnings ratio |
| England | 1997 | £59,160.67 | 9.25% | £325.00 | £16,958.04 | – | 3.49 |
| England | 1998 | £64,301.67 | 8.69% | £339.40 | £17,709.41 | 4.43% | 3.63 |
| England | 1999 | £70,070.75 | 8.97% | £347.80 | £18,147.71 | 2.47% | 3.86 |
| England | 2000 | £80,814.33 | 15.33% | £364.40 | £19,013.87 | 4.77% | 4.25 |
| England | 2001 | £90,306.75 | 11.75% | £381.70 | £19,916.56 | 4.75% | 4.53 |
| England | 2002 | £107,981.50 | 19.57% | £396.50 | £20,688.80 | 3.88% | 5.22 |
| England | 2003 | £130,218.58 | 20.59% | £410.60 | £21,424.52 | 3.56% | 6.08 |
| England | 2004 | £152,314.42 | 16.97% | £425.00 | £22,175.89 | 3.51% | 6.87 |
| England | 2005 | £163,570.00 | 7.39% | £436.00 | £22,749.86 | 2.59% | 7.19 |
| England | 2006 | £174,351.50 | 6.59% | £449.80 | £23,469.92 | 3.17% | 7.43 |
| England | 2007 | £190,025.58 | 8.99% | £463.60 | £24,189.99 | 3.07% | 7.86 |
| England | 2008 | £182,379.92 | -4.02% | £483.90 | £25,249.21 | 4.38% | 7.22 |
| England | 2009 | £166,558.67 | -8.67% | £495.00 | £25,828.39 | 2.29% | 6.45 |
| England | 2010 | £177,472.67 | 6.55% | £504.50 | £26,324.09 | 1.92% | 6.74 |
| England | 2011 | £175,230.00 | -1.26% | £504.00 | £26,298.00 | -0.10% | 6.66 |
| England | 2012 | £177,488.00 | 1.29% | £512.60 | £26,746.74 | 1.71% | 6.64 |
| England | 2013 | £182,581.42 | 2.87% | £520.30 | £27,148.51 | 1.50% | 6.73 |
| England | 2014 | £197,771.08 | 8.32% | £523.50 | £27,315.48 | 0.62% | 7.24 |
| England | 2015 | £211,174.75 | 6.78% | £531.60 | £27,738.13 | 1.55% | 7.61 |
| England | 2016 | £227,337.17 | 7.65% | £544.20 | £28,395.58 | 2.37% | 8.01 |
| England | 2017 | £238,161.17 | 4.76% | £555.80 | £29,000.85 | 2.13% | 8.21 |
| England | 2018 | £245,017.25 | 2.88% | £574.80 | £29,992.24 | 3.42% | 8.17 |
| England | 2019 | £246,634.83 | 0.66% | £592.20 | £30,900.15 | 3.03% | 7.98 |
| England | 2020 | £253,547.92 | 2.80% | £590.00 | £30,785.36 | -0.37% | 8.24 |
| England | 2021 | £273,144.58 | 7.73% | £613.30 | £32,001.12 | 3.95% | 8.54 |
| England | 2022 | £298,853.08 | 9.41% | £648.20 | £33,822.15 | 5.69% | 8.84 |
| England | 2023 | £299,648.25 | 0.27% | £683.50 | £35,664.05 | 5.45% | 8.40 |
Source: HM Land Registry, Office for National Statistics, StatsWales
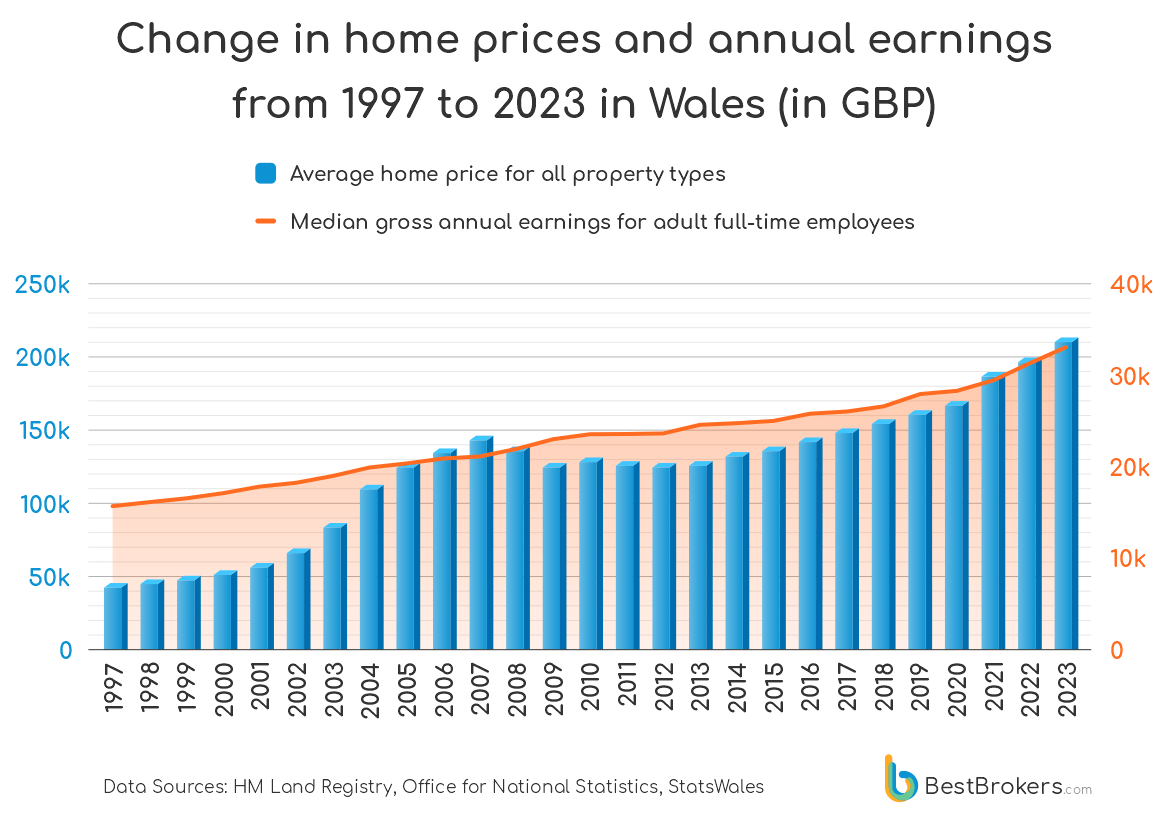
Since 1997, the average home price in Wales has surged from £45,488.33 to £212,917.33 by 2023, marking a staggering 368.07% increase. However, this growth was not consistent throughout; notable spikes occurred, particularly in the early 2000s, with a peak surge of 29.56% in 2004.
The data also highlights significant economic events, such as the housing market crash in 2008, when average home prices dropped by £7,622.50, a 5.21% decrease from the previous year. This decline continued into 2009, with a further 7.93% fall.
In terms of earnings, they rose from £15,679.66 in 1997 to £33,065.56 in 2023, representing an increase of approximately 110.88%. Notably, there was a substantial annual pay growth of 6.39% in 2022.
In 1997, the home price-to-earnings ratio was 2.90, indicating that the average home cost was about three times the annual earnings. This ratio peaked at 6.93 in 2007, coinciding with the onset of the global financial crisis. By 2023, the ratio had decreased to 6.44, down from 6.77 in 2022.
| Home affordability in Wales 1997-2023, Full Data | |||||||
|---|---|---|---|---|---|---|---|
| Country | Year | Average home price | YoY Home price change | Median weekly earings (gross, all adults) | Median annual earnings (gross, all adults) | YoY Earnings change | Home price-to-earnings ratio |
| Wales | 1997 | £45,488.33 | 5.60% | £300.50 | £15,679.66 | – | 2.90 |
| Wales | 1998 | £47,609.00 | 4.66% | £308.90 | £16,117.96 | 2.80% | 2.95 |
| Wales | 1999 | £50,125.75 | 5.29% | £316.80 | £16,530.17 | 2.56% | 3.03 |
| Wales | 2000 | £53,988.83 | 7.71% | £327.50 | £17,088.48 | 3.38% | 3.16 |
| Wales | 2001 | £58,658.75 | 8.65% | £341.30 | £17,808.55 | 4.21% | 3.29 |
| Wales | 2002 | £68,623.83 | 16.99% | £349.40 | £18,231.19 | 2.37% | 3.76 |
| Wales | 2003 | £86,981.00 | 26.75% | £363.60 | £18,972.13 | 4.06% | 4.58 |
| Wales | 2004 | £112,693.25 | 29.56% | £381.30 | £19,895.69 | 4.87% | 5.66 |
| Wales | 2005 | £127,646.92 | 13.27% | £389.70 | £20,333.99 | 2.20% | 6.28 |
| Wales | 2006 | £137,162.42 | 7.45% | £400.00 | £20,871.43 | 2.64% | 6.57 |
| Wales | 2007 | £146,273.83 | 6.64% | £404.30 | £21,095.80 | 1.08% | 6.93 |
| Wales | 2008 | £138,651.33 | -5.21% | £420.10 | £21,920.22 | 3.91% | 6.33 |
| Wales | 2009 | £127,657.58 | -7.93% | £440.40 | £22,979.44 | 4.83% | 5.56 |
| Wales | 2010 | £130,973.08 | 2.60% | £450.80 | £23,522.10 | 2.36% | 5.57 |
| Wales | 2011 | £128,410.67 | -1.96% | £451.30 | £23,548.19 | 0.11% | 5.45 |
| Wales | 2012 | £127,898.33 | -0.40% | £452.50 | £23,610.80 | 0.27% | 5.42 |
| Wales | 2013 | £128,423.25 | 0.41% | £470.50 | £24,550.02 | 3.98% | 5.23 |
| Wales | 2014 | £134,879.08 | 5.03% | £473.90 | £24,727.43 | 0.72% | 5.45 |
| Wales | 2015 | £138,631.50 | 2.78% | £478.60 | £24,972.66 | 0.99% | 5.55 |
| Wales | 2016 | £144,425.25 | 4.18% | £493.70 | £25,760.56 | 3.16% | 5.61 |
| Wales | 2017 | £150,566.25 | 4.25% | £498.30 | £26,000.58 | 0.93% | 5.79 |
| Wales | 2018 | £157,401.33 | 4.54% | £509.00 | £26,558.89 | 2.15% | 5.93 |
| Wales | 2019 | £163,480.08 | 3.86% | £534.80 | £27,905.10 | 5.07% | 5.86 |
| Wales | 2020 | £169,437.00 | 3.64% | £541.50 | £28,254.70 | 1.25% | 6.00 |
| Wales | 2021 | £188,971.83 | 11.53% | £563.70 | £29,413.06 | 4.10% | 6.42 |
| Wales | 2022 | £211,702.17 | 12.03% | £599.70 | £31,291.49 | 6.39% | 6.77 |
| Wales | 2023 | £212,917.33 | 0.57% | £633.70 | £33,065.56 | 5.67% | 6.44 |
Source: HM Land Registry, Office for National Statistics, StatsWales
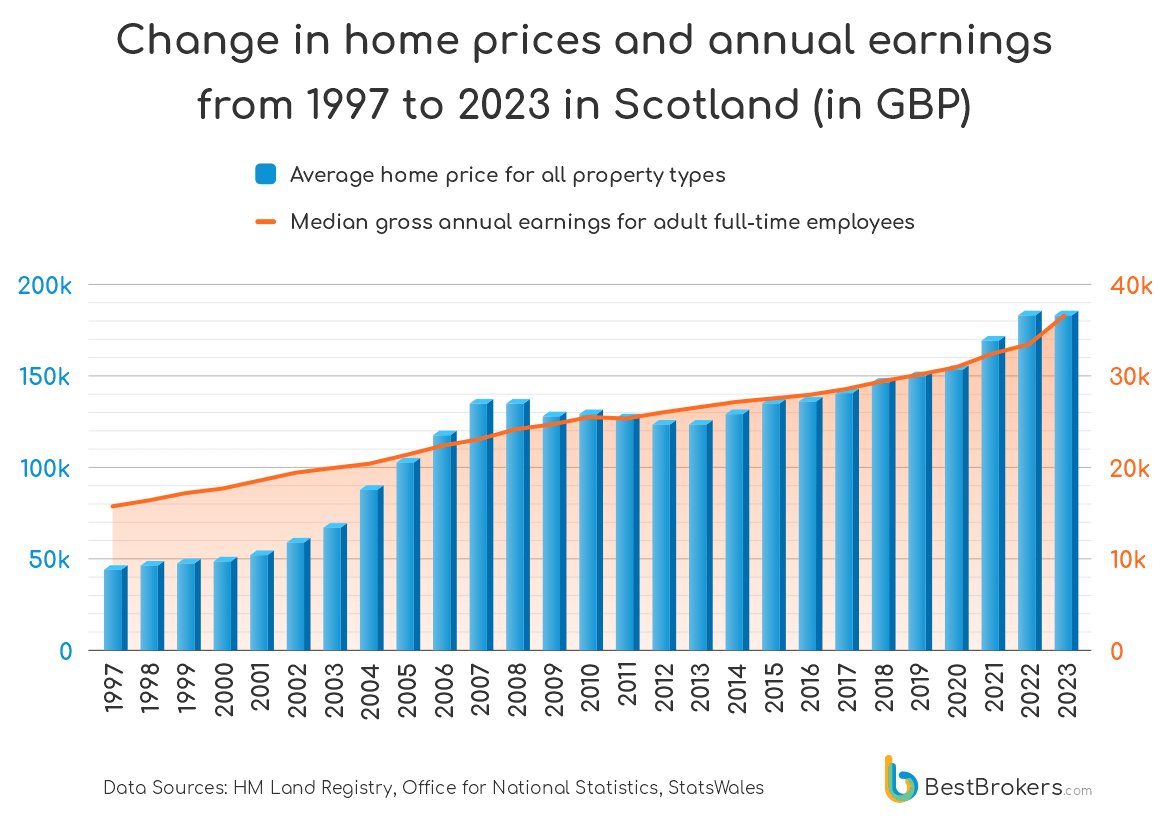
The average home prices in Scotland skyrocketed from £45,985.25 in 1997 to £184,932 in 2023, marking an overall increase of 302.16%. Significant spikes year to year were observed, such as a 28.75% rise in 2004 and 16.78% in 2005. However, there were also downturns, particularly in 2009 (-4.94%), 2011 (-1.83%), and 2012 (-3.27%).
Median annual earnings also saw substantial growth, up from £15,721.40 in 1997 to £36,671.10 in 2023, an increase of 133.26%. Yearly changes in earnings were generally positive, with significant upticks in 2001 (4.93%) and 2023 (9.73%).
In 1997, the home price-to-earnings ratio stood at 2.93, suggesting relatively affordable housing. The ratio peaked at 5.95 in 2007, reflecting the housing boom before the financial crisis, and then dipped to 4.74 in 2013 as the market corrected. By 2023, this ratio had reached 5.04, underlining the persistent difficulty for many Scots to achieve affordable homeownership.
| Home affordability in Scotland 1997-2023, Full Data | |||||||
|---|---|---|---|---|---|---|---|
| Country | Year | Average home price | YoY Home price change | Median weekly earings (gross, all adults) | Median annual earnings (gross, all adults) | YoY Earnings change | Home price-to-earnings ratio |
| Scotland | 1997 | £45,985.25 | 4.86% | £301.30 | £15,721.40 | – | 2.93 |
| Scotland | 1998 | £48,365.25 | 5.18% | £313.80 | £16,373.64 | 4.15% | 2.95 |
| Scotland | 1999 | £49,924.00 | 3.22% | £329.00 | £17,166.75 | 4.84% | 2.91 |
| Scotland | 2000 | £51,586.50 | 3.33% | £338.40 | £17,657.23 | 2.86% | 2.92 |
| Scotland | 2001 | £53,945.75 | 4.57% | £355.10 | £18,528.61 | 4.93% | 2.91 |
| Scotland | 2002 | £61,293.00 | 13.62% | £371.70 | £19,394.78 | 4.67% | 3.16 |
| Scotland | 2003 | £69,741.33 | 13.78% | £381.30 | £19,895.69 | 2.58% | 3.51 |
| Scotland | 2004 | £89,789.92 | 28.75% | £390.40 | £20,370.51 | 2.39% | 4.41 |
| Scotland | 2005 | £104,859.58 | 16.78% | £408.60 | £21,320.16 | 4.66% | 4.92 |
| Scotland | 2006 | £119,488.67 | 13.95% | £428.10 | £22,337.65 | 4.77% | 5.35 |
| Scotland | 2007 | £137,043.08 | 14.69% | £441.70 | £23,047.28 | 3.18% | 5.95 |
| Scotland | 2008 | £136,634.00 | -0.30% | £462.60 | £24,137.81 | 4.73% | 5.66 |
| Scotland | 2009 | £129,881.08 | -4.94% | £472.80 | £24,670.03 | 2.20% | 5.26 |
| Scotland | 2010 | £131,902.00 | 1.56% | £488.00 | £25,463.14 | 3.21% | 5.18 |
| Scotland | 2011 | £129,489.25 | -1.83% | £485.00 | £25,306.61 | -0.61% | 5.12 |
| Scotland | 2012 | £125,248.92 | -3.27% | £497.70 | £25,969.28 | 2.62% | 4.82 |
| Scotland | 2013 | £125,754.58 | 0.40% | £508.70 | £26,543.24 | 2.21% | 4.74 |
| Scotland | 2014 | £131,664.17 | 4.70% | £519.60 | £27,111.99 | 2.14% | 4.86 |
| Scotland | 2015 | £136,887.42 | 3.97% | £527.00 | £27,498.11 | 1.42% | 4.98 |
| Scotland | 2016 | £138,749.25 | 1.36% | £534.50 | £27,889.45 | 1.42% | 4.97 |
| Scotland | 2017 | £142,835.50 | 2.95% | £546.60 | £28,520.81 | 2.26% | 5.01 |
| Scotland | 2018 | £149,104.00 | 4.39% | £563.10 | £29,381.75 | 3.02% | 5.07 |
| Scotland | 2019 | £151,815.83 | 1.82% | £577.00 | £30,107.04 | 2.47% | 5.04 |
| Scotland | 2020 | £156,087.25 | 2.81% | £592.20 | £30,900.15 | 2.63% | 5.05 |
| Scotland | 2021 | £171,436.00 | 9.83% | £620.70 | £32,387.24 | 4.81% | 5.29 |
| Scotland | 2022 | £184,879.75 | 7.84% | £640.50 | £33,420.38 | 3.19% | 5.53 |
| Scotland | 2023 | £184,932.00 | 0.03% | £702.80 | £36,671.10 | 9.73% | 5.04 |
Source: HM Land Registry, Office for National Statistics, StatsWales
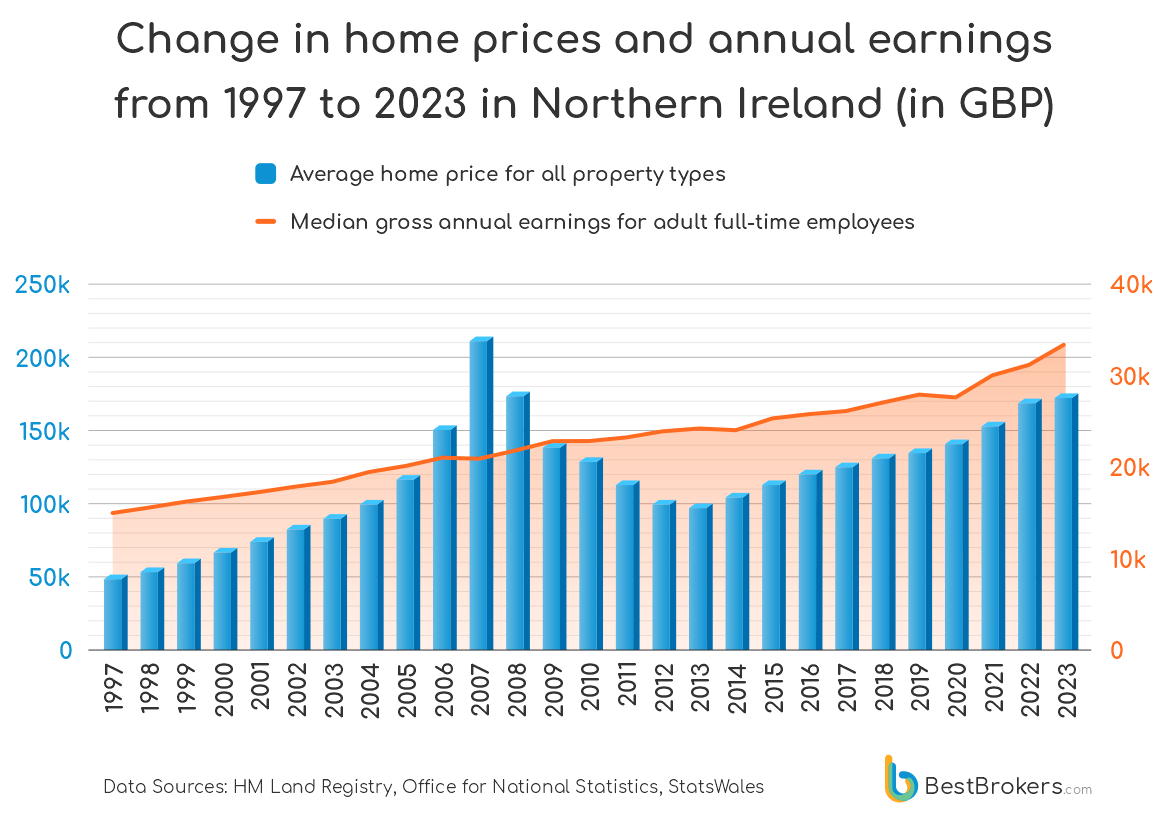
Since 1997, Northern Ireland’s housing market has also undergone remarkable shifts, starting with average home prices at £51,560.75 and peak affordability with a ratio of 3.45. Prices surged to £213,660.00 by 2007, marking an astonishing 314.38% increase over a decade. However, the global financial crisis in 2008 triggered a sharp decline, with prices plummeting to £141,384.25 by 2009—a significant 33.83% drop from the peak. Over time, the market stabilised, gradually recovering to £175,669.50 by 2023.
Over the same period, median annual earnings for full-time employees in Northern Ireland grew from £14,959.60 in 1997 to £33,456.90 by 2023—an increase of 123.65%. In 1997, the home price-to-earnings ratio stood at 3.45, reflecting the highest level of home affordability observed over nearly three decades. However, during the peak of the housing market in 2007, this ratio spiked to 10.23, indicating severe affordability challenges. By 2023, the ratio had improved to 5.25, down by 0.24 points from 5.49 in 2022,
| Home affordability in Northern Ireland 1997-2023, Full Data | |||||||
|---|---|---|---|---|---|---|---|
| Country | Year | Average home price | YoY Home price change | Median weekly earings (gross, all adults) | Median annual earnings (gross, all adults) | YoY Earnings change | Home price-to-earnings ratio |
| Northern Ireland | 1997 | £51,560.75 | 10.35% | £286.70 | £14,959.60 | – | 3.45 |
| Northern Ireland | 1998 | £56,564.75 | 9.71% | £298.10 | £15,554.43 | 3.98% | 3.64 |
| Northern Ireland | 1999 | £62,048.25 | 9.69% | £310.50 | £16,201.45 | 4.16% | 3.83 |
| Northern Ireland | 2000 | £69,457.75 | 11.94% | £320.20 | £16,707.58 | 3.12% | 4.16 |
| Northern Ireland | 2001 | £77,180.00 | 11.12% | £330.50 | £17,245.02 | 3.22% | 4.48 |
| Northern Ireland | 2002 | £85,066.33 | 10.22% | £342.00 | £17,845.07 | 3.48% | 4.77 |
| Northern Ireland | 2003 | £92,483.58 | 8.72% | £352.00 | £18,366.86 | 2.92% | 5.04 |
| Northern Ireland | 2004 | £102,328.25 | 10.64% | £372.60 | £19,441.74 | 5.85% | 5.26 |
| Northern Ireland | 2005 | £119,746.00 | 17.02% | £385.20 | £20,099.19 | 3.38% | 5.96 |
| Northern Ireland | 2006 | £153,897.50 | 28.52% | £402.50 | £21,001.88 | 4.49% | 7.33 |
| Northern Ireland | 2007 | £213,660.00 | 38.83% | £400.30 | £20,887.08 | -0.55% | 10.23 |
| Northern Ireland | 2008 | £176,514.25 | -17.39% | £417.70 | £21,794.99 | 4.35% | 8.10 |
| Northern Ireland | 2009 | £141,384.25 | -19.90% | £437.10 | £22,807.25 | 4.64% | 6.20 |
| Northern Ireland | 2010 | £131,723.75 | -6.83% | £437.30 | £22,817.69 | 0.05% | 5.77 |
| Northern Ireland | 2011 | £115,786.25 | -12.10% | £444.70 | £23,203.81 | 1.69% | 4.99 |
| Northern Ireland | 2012 | £102,858.00 | -11.17% | £457.60 | £23,876.91 | 2.90% | 4.31 |
| Northern Ireland | 2013 | £99,925.25 | -2.85% | £463.60 | £24,189.99 | 1.31% | 4.13 |
| Northern Ireland | 2014 | £107,616.75 | 7.70% | £460.00 | £24,002.14 | -0.78% | 4.48 |
| Northern Ireland | 2015 | £115,438.00 | 7.27% | £484.70 | £25,290.95 | 5.37% | 4.56 |
| Northern Ireland | 2016 | £122,972.50 | 6.53% | £493.60 | £25,755.34 | 1.84% | 4.77 |
| Northern Ireland | 2017 | £127,610.75 | 3.77% | £500.00 | £26,089.29 | 1.30% | 4.89 |
| Northern Ireland | 2018 | £133,442.50 | 4.57% | £517.80 | £27,018.06 | 3.56% | 4.94 |
| Northern Ireland | 2019 | £138,093.25 | 3.49% | £534.50 | £27,889.45 | 3.23% | 4.95 |
| Northern Ireland | 2020 | £143,190.25 | 3.69% | £528.70 | £27,586.81 | -1.09% | 5.19 |
| Northern Ireland | 2021 | £155,394.50 | 8.52% | £574.90 | £29,997.46 | 8.74% | 5.18 |
| Northern Ireland | 2022 | £171,022.50 | 10.06% | £596.80 | £31,140.17 | 3.81% | 5.49 |
| Northern Ireland | 2023 | £175,669.50 | 2.72% | £641.20 | £33,456.90 | 7.44% | 5.25 |
Source: HM Land Registry, Office for National Statistics, StatsWales
Regional Breakdown of Home Affordability in England for 2023
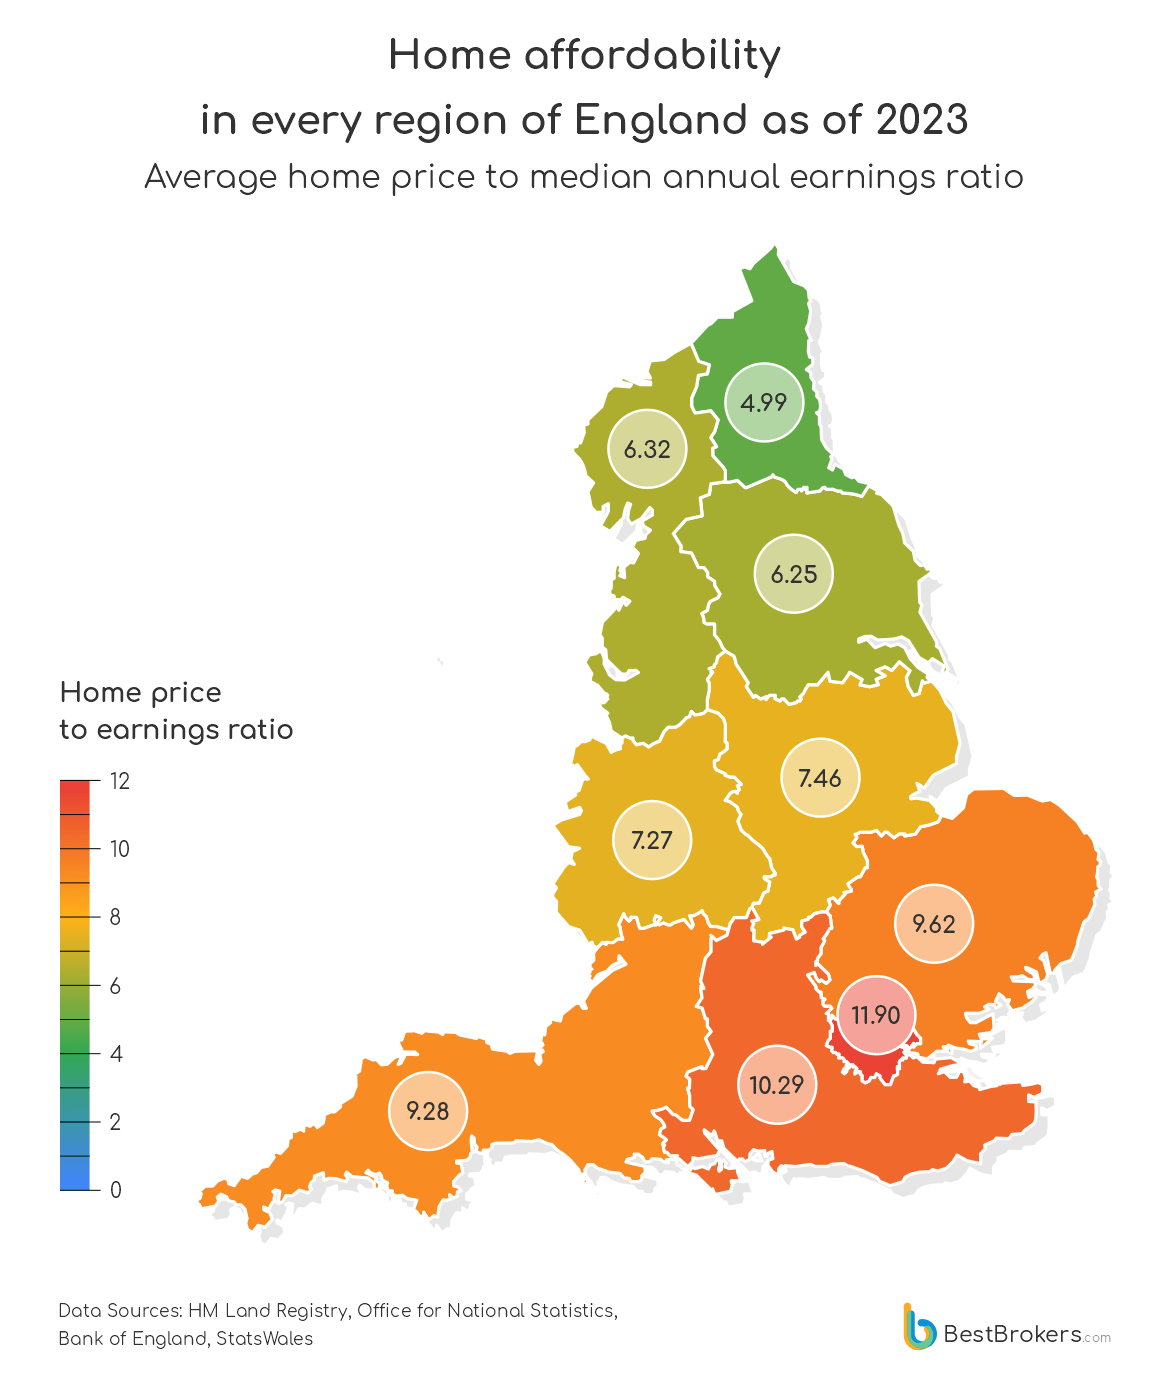
In 2023, London stood out as the least affordable region in England for prospective homebuyers. The average home was priced at £521,106.42, nearly twelve times the annual earnings of full-time employees, which amounted to £43,772.60. The South East followed closely with homes averaging £378,126.92, equivalent to about ten and a half times the annual pay of £36,749.37. In the East of England, buyers needed 9.62 years’ worth of median annual earnings (£35,142.27) to afford a home priced at £338,205.25. The South West also faced significant affordability issues, with a home price-to-earnings ratio of 9.28.
On the flip side, the North East emerged as the most affordable region in England for home seekers in 2023. The average home price of £158,450.67 was about five times the annual earnings of £31,745.44. Yorkshire and The Humber came next with a home price-to-income ratio of 6.25, closely followed by the North West, at 6.32.
Methodology
To analyse the changes in home affordability in the United Kingdom over the past 57 years, our team at BestBrokers utilised data from the HM Land Registry, one of the largest property databases in Europe. It records average sale prices of various property types across the UK starting from 1968 to the present. Additionally, we obtained gross weekly earnings figures for adult full-time employees from the Office for National Statistics, the Bank of England and the Welsh Government.
First, our team calculated the annual average home prices for all property types in the UK for every year from 1968 up to 2024. This involved aggregating and averaging quarterly and monthly data to provide an average yearly figure. Next, using the gross weekly earnings data, we estimated annual earnings for full-time employees by multiplying the weekly earnings by 52.17857143 weeks per year. This figure takes into account the average number of weeks in a year, including the extra day from leap years. A year has approximately 52.142857 weeks (365 days / 7 days per week), but considering the extra day from leap years every four years, the average becomes 52.17857143 weeks per year.
We then calculated the home price-to-earnings ratio (the number of years’ worth of earnings required to buy an average home in the UK annually) by dividing the average home price by the median annual earnings for each year of the study period. Additionally, we conducted a comprehensive analysis of home affordability across each constituent country of the UK and within the regions of England, focusing on data from 1997 to 2023.
| Home affordability in the United Kingdom 1968-2024, Full Data | |||||||
|---|---|---|---|---|---|---|---|
| Year | Average home price | YoY Home price change | Median weekly earings (gross, all adults) | Median annual earnings (gross, all adults) | YoY Earnings change | Home price-to-earnings ratio | Bank of England Rate (%, at year end) |
| 1968 | £3,669.00 | – | £15.19 | £792.59 | – | 4.63 | N/D |
| 1969 | £3,833.25 | 4.48% | £16.36 | £853.64 | 7.70% | 4.49 | N/D |
| 1970 | £4,056.50 | 5.82% | £18.44 | £962.17 | 12.71% | 4.22 | N/D |
| 1971 | £4,539.25 | 11.90% | £20.65 | £1,077.49 | 11.98% | 4.21 | N/D |
| 1972 | £6,067.25 | 33.66% | £23.25 | £1,213.15 | 12.59% | 5.00 | N/D |
| 1973 | £8,347.00 | 37.57% | £26.62 | £1,388.99 | 14.49% | 6.01 | N/D |
| 1974 | £9,001.75 | 7.84% | £31.66 | £1,651.97 | 18.93% | 5.45 | N/D |
| 1975 | £9,529.50 | 5.86% | £40.82 | £2,129.93 | 28.93% | 4.47 | 11.25 |
| 1976 | £10,372.50 | 8.85% | £47.56 | £2,481.61 | 16.51% | 4.18 | 14.25 |
| 1977 | £11,134.00 | 7.34% | £52.30 | £2,728.94 | 9.97% | 4.08 | 7 |
| 1978 | £12,956.75 | 16.37% | £59.23 | £3,090.54 | 13.25% | 4.19 | 12.5 |
| 1979 | £16,764.75 | 29.39% | £69.14 | £3,607.63 | 16.73% | 4.65 | 17 |
| 1980 | £20,267.75 | 20.90% | £83.99 | £4,382.48 | 21.48% | 4.62 | 14 |
| 1981 | £21,430.50 | 5.74% | £95.56 | £4,986.18 | 13.78% | 4.30 | 14.38 |
| 1982 | £21,938.25 | 2.37% | £104.83 | £5,469.88 | 9.70% | 4.01 | 10 |
| 1983 | £24,522.75 | 11.78% | £113.91 | £5,943.66 | 8.66% | 4.13 | 9.06 |
| 1984 | £26,807.25 | 9.32% | £142.30 | £7,425.01 | 24.92% | 3.61 | 9.5 |
| 1985 | £29,142.75 | 8.71% | £152.50 | £7,957.23 | 7.17% | 3.66 | 11.38 |
| 1986 | £33,103.00 | 13.59% | £163.80 | £8,546.85 | 7.41% | 3.87 | 10.88 |
| 1987 | £38,661.75 | 16.79% | £175.10 | £9,136.47 | 6.90% | 4.23 | 8.38 |
| 1988 | £49,319.50 | 27.57% | £190.90 | £9,960.89 | 9.02% | 4.95 | 12.88 |
| 1989 | £58,876.75 | 19.38% | £209.30 | £10,920.98 | 9.64% | 5.39 | 14.88 |
| 1990 | £58,162.50 | -1.21% | £229.40 | £11,969.76 | 9.60% | 4.86 | 13.88 |
| 1991 | £57,333.25 | -1.43% | £246.90 | £12,882.89 | 7.63% | 4.45 | 10.38 |
| 1992 | £55,052.75 | -3.98% | £264.60 | £13,806.45 | 7.17% | 3.99 | 6.88 |
| 1993 | £54,121.25 | -1.69% | £273.30 | £14,260.40 | 3.29% | 3.80 | 5.38 |
| 1994 | £55,559.00 | 2.66% | £281.90 | £14,709.14 | 3.15% | 3.78 | 6.13 |
| 1995 | £55,938.50 | 0.68% | £290.30 | £15,147.44 | 2.98% | 3.69 | 6.38 |
| 1996 | £57,986.25 | 3.66% | £301.10 | £15,710.97 | 3.72% | 3.69 | 5.94 |
| 1997 | £63,085.00 | 8.79% | £320.50 | £16,723.23 | 6.44% | 3.77 | 7.25 |
| 1998 | £70,313.00 | 11.46% | £334.90 | £17,474.60 | 4.49% | 4.02 | 6.25 |
| 1999 | £77,961.25 | 10.88% | £345.50 | £18,027.70 | 3.17% | 4.32 | 5.5 |
| 2000 | £89,596.50 | 14.92% | £359.00 | £18,732.11 | 3.91% | 4.78 | 6 |
| 2001 | £96,892.50 | 8.14% | £375.90 | £19,613.93 | 4.71% | 4.94 | 4 |
| 2002 | £112,519.58 | 16.13% | £390.90 | £20,396.60 | 3.99% | 5.52 | 4 |
| 2003 | £130,164.25 | 15.68% | £404.00 | £21,080.14 | 3.35% | 6.17 | 3.75 |
| 2004 | £145,608.58 | 11.87% | £419.20 | £21,873.26 | 3.76% | 6.66 | 4.75 |
| 2005 | £156,236.25 | 7.30% | £431.20 | £22,499.40 | 2.86% | 6.94 | 4.5 |
| 2006 | £168,513.00 | 7.86% | £443.60 | £23,146.41 | 2.88% | 7.28 | 5 |
| 2007 | £185,196.33 | 9.90% | £457.60 | £23,876.91 | 3.16% | 7.76 | 5.5 |
| 2008 | £176,852.75 | -4.51% | £479.10 | £24,998.75 | 4.70% | 7.07 | 2 |
| 2009 | £161,147.92 | -8.88% | £488.50 | £25,489.23 | 1.96% | 6.32 | 0.5 |
| 2010 | £170,364.58 | 5.72% | £498.50 | £26,011.02 | 2.05% | 6.55 | 0.5 |
| 2011 | £167,888.42 | -1.45% | £498.30 | £26,000.58 | -0.04% | 6.46 | 0.5 |
| 2012 | £168,555.67 | 0.40% | £506.10 | £26,407.58 | 1.57% | 6.38 | 0.5 |
| 2013 | £172,889.67 | 2.57% | £517.40 | £26,997.19 | 2.23% | 6.40 | 0.5 |
| 2014 | £186,769.75 | 8.03% | £518.30 | £27,044.15 | 0.17% | 6.91 | 0.5 |
| 2015 | £197,890.00 | 5.95% | £527.10 | £27,503.33 | 1.70% | 7.20 | 0.5 |
| 2016 | £211,724.67 | 6.99% | £538.60 | £28,103.38 | 2.18% | 7.53 | 0.25 |
| 2017 | £221,402.67 | 4.57% | £550.00 | £28,698.21 | 2.12% | 7.71 | 0.5 |
| 2018 | £228,354.08 | 3.14% | £568.30 | £29,653.08 | 3.33% | 7.70 | 0.75 |
| 2019 | £230,611.83 | 0.99% | £585.20 | £30,534.90 | 2.97% | 7.55 | 0.75 |
| 2020 | £237,217.58 | 2.86% | £585.70 | £30,560.99 | 0.09% | 7.76 | 0.1 |
| 2021 | £256,534.08 | 8.14% | £609.80 | £31,818.49 | 4.11% | 8.06 | 0.25 |
| 2022 | £280,603.58 | 9.38% | £641.80 | £33,488.21 | 5.25% | 8.38 | 3.5 |
| 2023 | £281,645.67 | 0.37% | £681.70 | £35,570.13 | 6.22% | 7.92 | 5.25 |
| 2024 | £281,384.33 | -0.09% | £682.00 | £35,585.79 | 0.04% | 7.91 | 5.25 |
Source: HM Land Registry, Office for National Statistics, Bank of England, StatsWales
Weekly earnings before 1984 are from the Bank of England
Average home price for 1968 is for Q2, Q3, Q4 of the year
Average home price for 2024 is for Q1 of the year
Median weekly earnings for 2024 are for March