Crypto exchanges, like all websites, produce carbon emissions; the more sophisticated and visited they are, the more data they process, requiring serious server power to run them. This all comes at a high cost to the environment, especially when we consider that for many, cryptocurrencies are just a fad – overhyped digital currencies which, compared to fiat, are not really capable of supporting an economy.
Clearly, cryptocurrency mining is the biggest culprit when it comes to CO₂ emissions, with estimations for worldwide Bitcoin mining operations alone reaching 140.38TWh in annual electricity consumption, as shown in a recent analysis by our team at BestBrokers. Depending on the power source, the resulting CO₂ emissions could reach a whopping 115 million metric tons; and this is just a fraction of the greenhouse gasses produced by the crypto world.
To get an understanding of how serious the environmental impact of cryptocurrencies is, we also devised a way to calculate the electric power drained for broadcasting a single transaction on the Bitcoin blockchain. Another unknown in the calculation is crypto exchanges where the buying and selling of digital currencies happen. To determine their carbon footprint, we utilised the Website Carbon Calculator, checking the CO₂ emissions from the website traffic of the twenty most popular crypto exchanges by trading volume. Since blockchain technology is also central to the creation and use of NFTs (non-fungible tokens), we also looked at the twenty largest NFT marketplaces by monthly trading volume to see the largest CO₂ emitters.
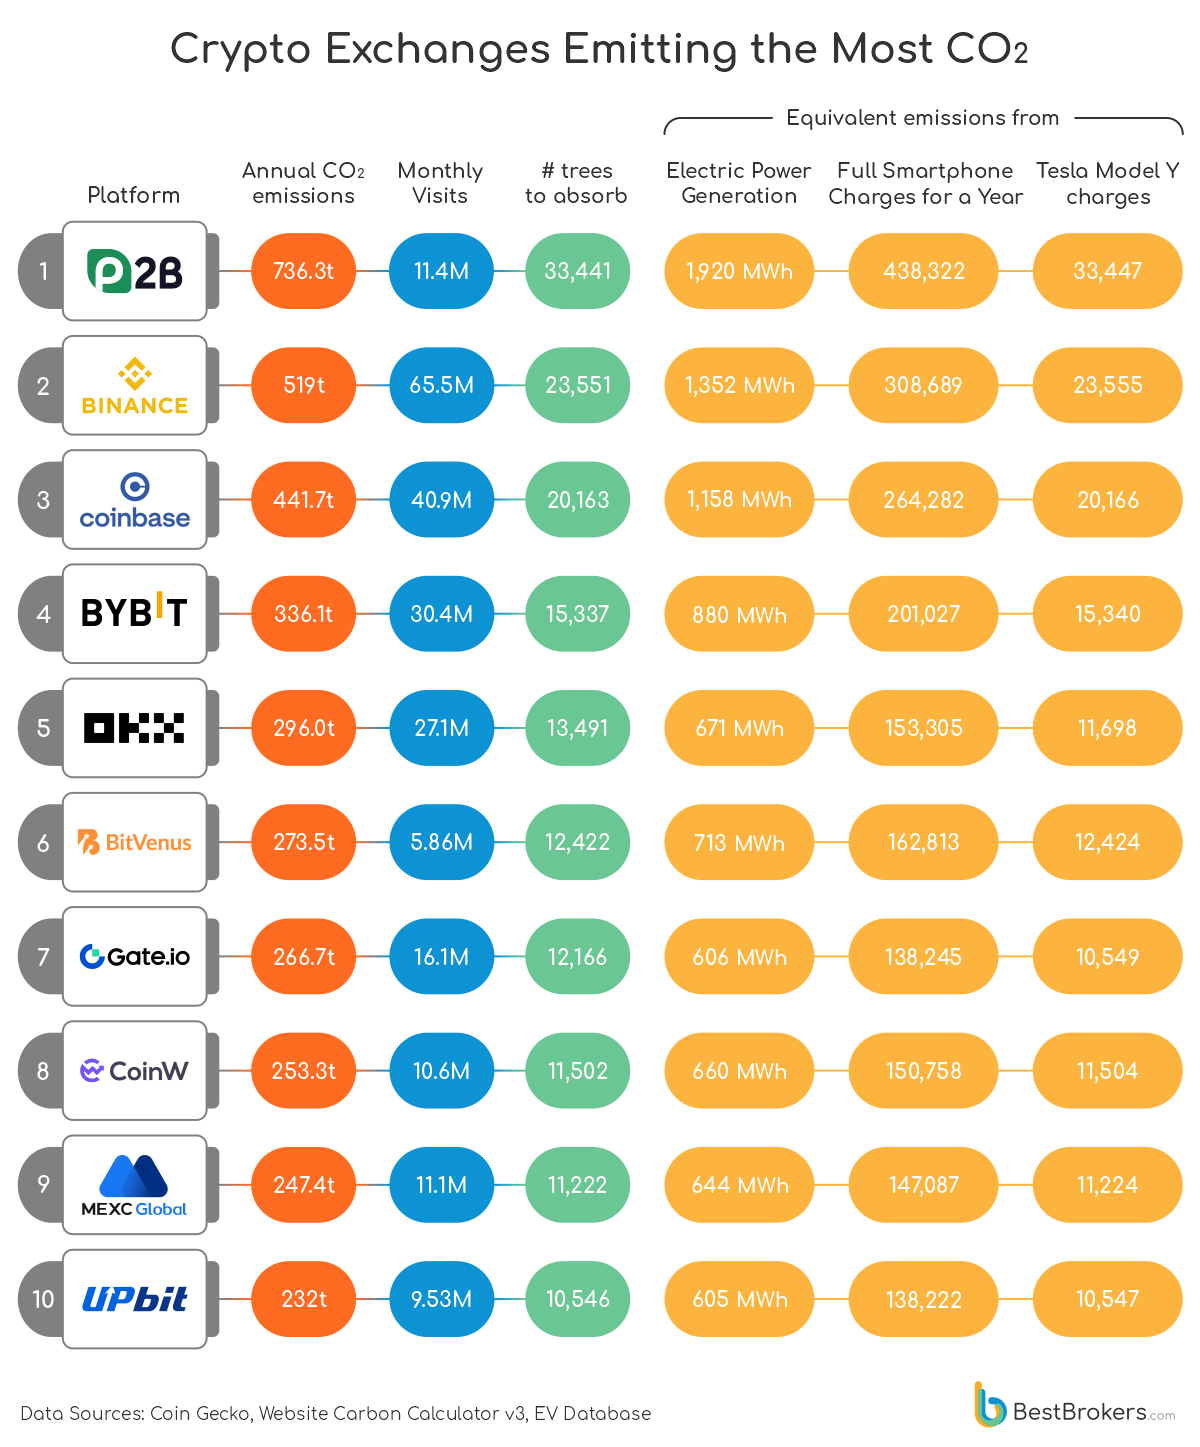
But first, these are the crypto exchanges producing the most carbon dioxide:

Centralised cryptocurrency exchange P2B is the platform most detrimental to the environment according to our calculations. With a daily trading volume of roughly $1.5 billion, 200 different cryptocurrencies and fiat money, as well as 11.4 million monthly visits, P2B is one of the largest digital assets exchanges in the world. However, the heavy website traffic and the production of 5.38 grams of CO₂ per page view mean that the platform is ultimately responsible for 736.3 metric tons of carbon dioxide being released into the atmosphere every year.
This much CO₂ can be absorbed by 33,441 trees, which take up this greenhouse gas from the air around them and convert the carbon in it into glucose. Through this process, known as photosynthesis, of course, the glucose nourishes the tree and helps it grow.
Interestingly, the amount of CO₂ produced annually by P2B is equivalent to the emissions released by the generation of 1,920 MWh of electric power if the source is coal (just over a third of global power generation comes from coal). This electricity is enough to charge your smartphone every day for a year – yours, along with another 438,321 smartphones. It is also enough to charge 33,447 Tesla Model Y cars (full charge), considering an average consumption of 0.164 kWh per kilometer for this model and a range of 350 kilometres.
Binance, the world’s largest centralised crypto exchange, also features prominently as a massive CO₂ emitter. It contributes to the warming of the planet with 0.66 grams of CO₂ per page visit or approximately 519 million tons of CO₂ per year. Coinbase, another hugely popular crypto exchange, has a sizeable carbon footprint, too, with 0.9 grams of CO₂ per page visit and 441.7 tons of CO₂ annually.
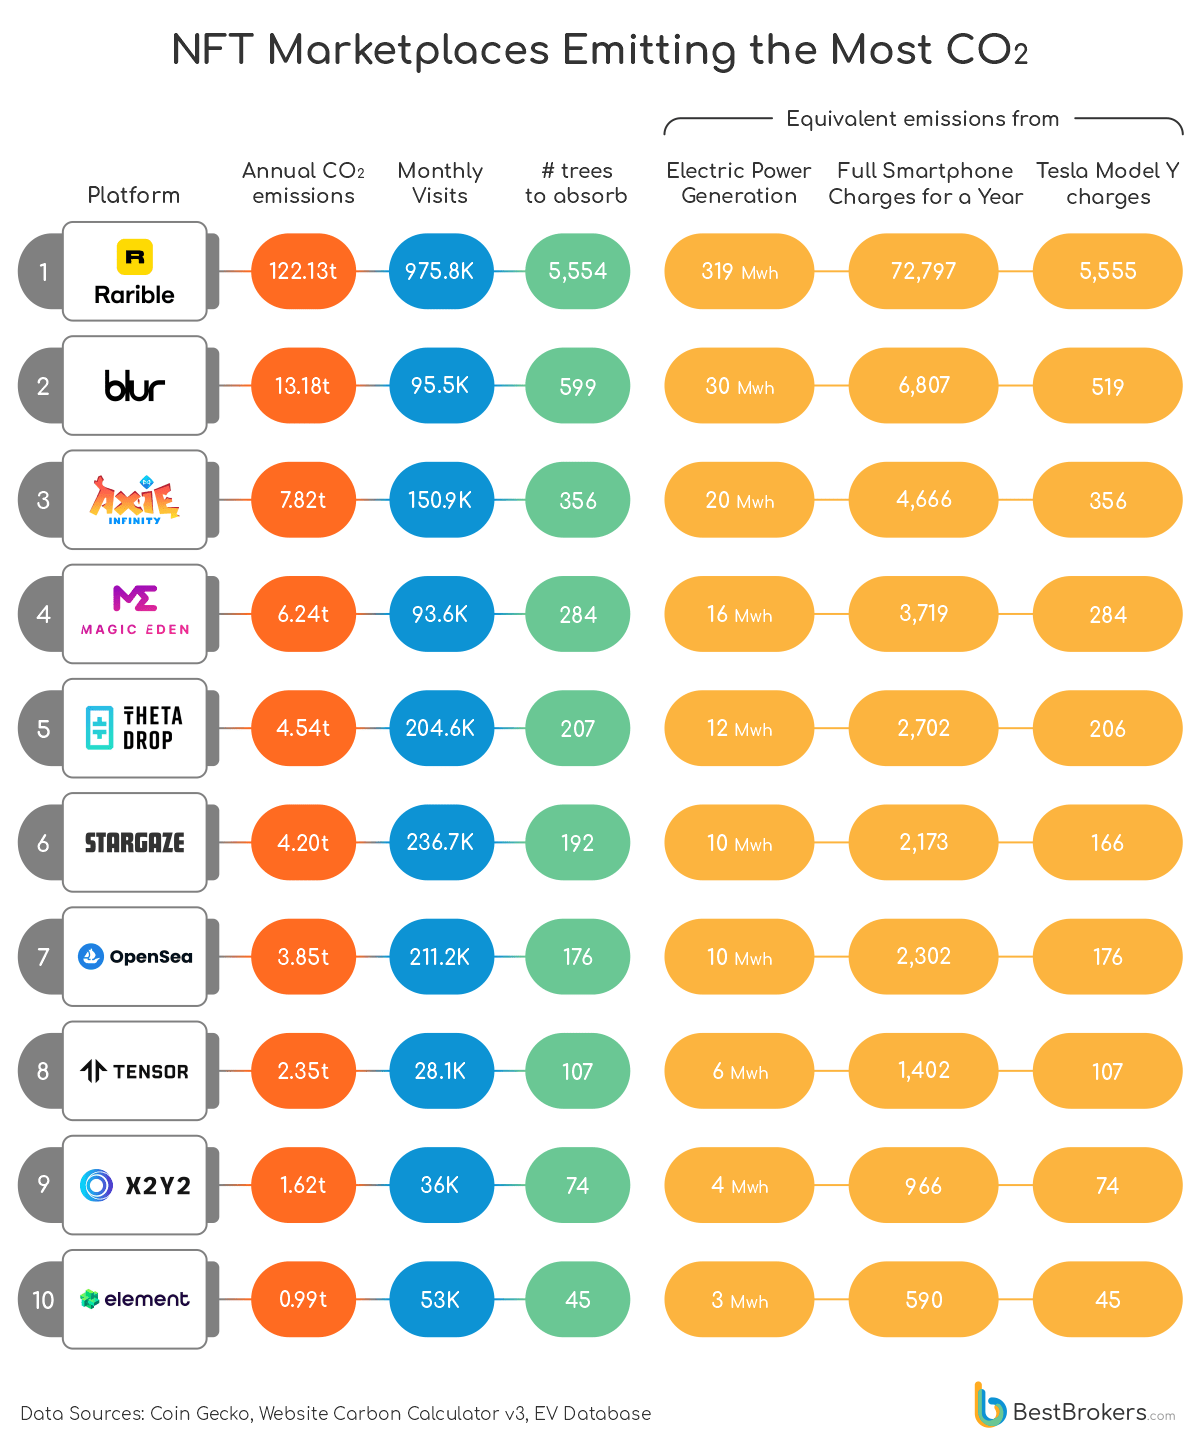
NFT Marketplaces with the Heaviest Carbon Footprint

The environmental impact from NFTs has not been as significant as the one we have seen linked with cryptocurrencies, especially after 2022 when Ethereum switched to the less energy-intensive Proof-of-Stake (versus Proof-of-Work used by Bitcoin, for example) consensus mechanism. Since so many of these digital tokens are Ethereum-based, the energy consumption and carbon emissions of their minting and transactions have decreased. NFT marketplaces, however, seem to be linked to the release of a lot of carbon dioxide, especially when we know they are not as popular as they were just a couple of years ago.
However, certain platforms such as OpenSea or Rarible, are currently widely used by artists, NFT owners and crypto enthusiasts to sell and buy these digital assets. Rarible, in particular, is the worst CO₂ emitter out of the twenty marketplaces we reviewed, although it is relatively small in terms of trading volume. It has roughly $1.18 million in monthly trades but the 976 thousand visits per month are coupled with 10.43 grams of CO₂ per visit, the second-highest amount we have seen in this comparison after Blur’s.
This means that Rarible is responsible for emitting 122.13 metric tons of carbon dioxide every year. Other large and popular NFT marketplaces are also ranking high on our list of CO₂-producing platforms. Blur, the largest marketplace by monthly trading volume (currently at least) produces 13.18 tons of CO₂ per year, followed by Axie Marketplace and its 7.82 tons of CO₂ annually. OpenSea ranks 7th with 3.85 tons of carbon dioxide released into the atmosphere every year.
Methodology
To review the largest cryptocurrency exchanges, the team at BestBrokers looked at the daily trading volumes in U.S. dollars as shown by CoinGecko. We checked the carbon emissions per web page visit of the 20 platforms with the most sizeable trading volumes using the online calculator of the WebsiteCarbon page.
Information about the most used NFT marketplaces, on the other hand, was sourced from DappRadar. For this comparison, we looked at trading volumes for a much larger period, a month rather than a day. Once again, we tested the platforms’ CO₂ emissions with the help of the online calculator.
To determine how much electricity is consumed by a full charge of a Tesla Model Y, we looked up the power consumption of this model, as well as its range (how far it can travel on a full charge) from the EV Database website. Using these, we calculated the electricity drained from charging a Model Y in kWh. Why Tesla Model Y? Because this is currently the best-selling electric vehicle in the world. For this report, we used measurements in metric since this is what carbon dioxide emissions are most commonly calculated and shown in.
Raw data
Crypto Exchanges Emitting the Most CO2
| Platform | Monthly Visits | Normalized Trading Volume (24h, as of July 4) | CO2 Emissions per visit, in grams | Annual CO2 emissions (in metric tons) | Trees Needed to Absorb the CO2 | Electric Power with Equivalent Emissions (MWh) | Full Smartphone Charges for a Year | Tesla Model Y charges |
|---|---|---|---|---|---|---|---|---|
| P2B | 11.4М | $1,497,729,843.00 | 5.38 | 736.3 | 33441 | 1920 | 438322 | 33447 |
| Binance | 65.5M | $9,612,392,817.00 | 0.66 | 519 | 23551 | 1352 | 308689 | 23555 |
| Coinbase Exchange | 40.9М | $2,468,115,460.00 | 0.9 | 441.7 | 20163 | 1158 | 264282 | 20166 |
| Bybit | 30.4M | $4,484,821,788.00 | 0.92 | 336.1 | 15337 | 880 | 201027 | 15340 |
| OKX | 27.1M | $2,482,384,647.00 | 0.91 | 296 | 13491 | 671 | 153305 | 11698 |
| BitVenus | 5.86M | $864,694,067.00 | 3.89 | 273.5 | 12422 | 713 | 162813 | 12424 |
| Gate.io | 16.1M | $2,366,497,944.00 | 1.38 | 266.7 | 12166 | 606 | 138245 | 10549 |
| CoinW | 10.6M | $1,402,324,545.00 | 1.99 | 253.3 | 11502 | 660 | 150758 | 11504 |
| MEXC | 11.1M | $1,508,279,227.00 | 1.86 | 247.4 | 11222 | 644 | 147087 | 11224 |
| UpBit | 9.53M | $1,377,819,900.00 | 2.03 | 232 | 10546 | 605 | 138222 | 10547 |
| Biconomy | 8.26M | $845,738,608.00 | 2.15 | 213.2 | 9695 | 557 | 127075 | 9697 |
| Tapbit | 6.86M | $1,011,762,897.00 | 2.43 | 200.1 | 9110 | 453 | 103520 | 7899 |
| WhiteBIT | 24.8M | $2,654,102,179.00 | 0.57 | 169.9 | 7717 | 443 | 101142 | 7718 |
| LBank | 13.1M | $1,439,141,601.00 | 1.05 | 164.8 | 7481 | 429 | 98047 | 7482 |
| XT.COM | 8.63M | $1,273,362,869.00 | 1.59 | 164.7 | 7463 | 428 | 97815 | 7464 |
| BitMart | 12.5M | $1,843,045,115.00 | 0.86 | 129.5 | 5901 | 339 | 77345 | 5902 |
| DigiFinex | 10.7M | $1,572,201,306.00 | 0.92 | 118.1 | 5373 | 308 | 70421 | 5374 |
| LATOKEN | 5.43M | $799,522,928.00 | 1.49 | 97.1 | 4408 | 253 | 57767 | 4408 |
| BigONE | 7.58M | $832,590,554.00 | 1.04 | 94.6 | 4284 | 213 | 48682 | 3715 |
| Deepcoin | 6.29M | $927,688,295.00 | 1.22 | 92.1 | 4202 | 241 | 55074 | 4203 |
NFT Marketplaces Emitting the Most CO2
| Platform | Monthly visits | Trading Volume (30 days) | CO2 Emissions per visit, in grams | Annual CO2 emissions (in metric tons) | Trees Needed to Absorb the CO2 | Electric Power with Equivalent Emissions (MWh) | Smartphones that can be charged per year | Tesla Model Y can be charged (# of times) |
|---|---|---|---|---|---|---|---|---|
| Rarible | 975.8K | $1,180,000.00 | 10.43 | 122.13 | 5554 | 318.85 | 72797 | 5555 |
| Blur | 95.5K | $296,180,000.00 | 11.5 | 13.18 | 599 | 29.81 | 6807 | 519 |
| Axie Marketplace | 150.9K | $3,020,000.00 | 4.32 | 7.82 | 356 | 20.44 | 4666 | 356 |
| Magic Eden | 93.6K | $115,110,000.00 | 5.56 | 6.24 | 284 | 16.29 | 3719 | 284 |
| ThetaDrop | 204.6K | $809,170.00 | 1.85 | 4.54 | 207 | 11.84 | 2702 | 206 |
| Stargaze | 236.7K | $1,350,000.00 | 1.48 | 4.2 | 192 | 9.52 | 2173 | 166 |
| OpenSea | 211.2K | $137,920,000.00 | 1.52 | 3.85 | 176 | 10.08 | 2302 | 176 |
| Tensor | 28.1K | $17,110,000.00 | 6.98 | 2.35 | 107 | 6.14 | 1402 | 107 |
| X2Y2 | 36K | $2,700,000.00 | 3.75 | 1.62 | 74 | 4.23 | 966 | 74 |
| Element Market | 53K | $26,120,000.00 | 1.56 | 0.99 | 45 | 2.58 | 590 | 45 |
| JPG Store | 7.3K | $1,490,000.00 | 9.26 | 0.81 | 37 | 2.11 | 481 | 37 |
| Mavis Market | 18.3K | $2,320,000.00 | 2.74 | 0.6 | 28 | 1.58 | 359 | 27 |
| Treasure | 8.7K | $1,770,000.00 | 5.01 | 0.52 | 24 | 1.36 | 311 | 24 |
| OKX NFT Marketplace | 64.3K | $38,990,000.00 | 0.51 | 0.39 | 18 | 1.03 | 236 | 18 |
| TokenTrove | 11K | $799,270.00 | 2.77 | 0.37 | 17 | 0.83 | 189 | 14 |
| UniSat | 45K | $26,290,000.00 | 0.66 | 0.36 | 17 | 0.93 | 213 | 16 |
| Sorare | 30.9K | $3,210,000.00 | 0.82 | 0.3 | 14 | 0.8 | 181 | 14 |
| MOOAR | 5.1K | $9,690,000.00 | 3.16 | 0.19 | 9 | 0.51 | 116 | 9 |
| fantasy.top | 12.6K | $9,590,000.00 | 1.24 | 0.19 | 9 | 0.49 | 112 | 9 |
| Immutable X Marketplace | 16.6K | $12,050,000.00 | 0.54 | 0.11 | 5 | 0.24 | 55 | 4 |
