
- Eight out of the ten largest companies by market cap are tech companies, and eight are American
- The United States is home to the most billion-dollar companies, 1,873 in total
- European microstate Monaco has the most billion-dollar companies per capita in the world
For decades, the global economy has been dominated by a handful of nations, whose wealth, natural resources, manufacturing power, and technological advancements have dwarfed the achievements of the rest of the world. The United States is home to many of the largest corporations in terms of both revenue and market capitalisation. Of the 5 thousand companies with a market cap of at least $1 billion, 1,873 are American. Another 1,400 corporations or so are concentrated within China, India, Japan, Canada, and the United Kingdom.
While the number of large-cap companies in a particular country shows the size of the national economy, it also heavily favours those nations with massive populations. Figures alone are not really capable of revealing the current state of the economy, especially in 2025, when inequality seems to be greater than ever and in contrast with recent conclusions by the World Bank that the number of highly unequal countries has dropped from 77 in 2000 to just 52 in 2022. As billionaires are now more and wealthier than ever and corporations generate billions of dollars in revenue for their shareholders, the team at BestBrokers is looking into the billion-dollar companies and where they are located around the world.
Using data from the companies tracking site CompaniesMarketCap, we identified 5,522 publicly traded companies with a market capitalisation of over $1 billion. While the United States is home to the largest number of billion-dollar companies, 1,873 in total as of March 17 2025, Monaco, Luxembourg, and Iceland have the most billion-dollar businesses per capita.
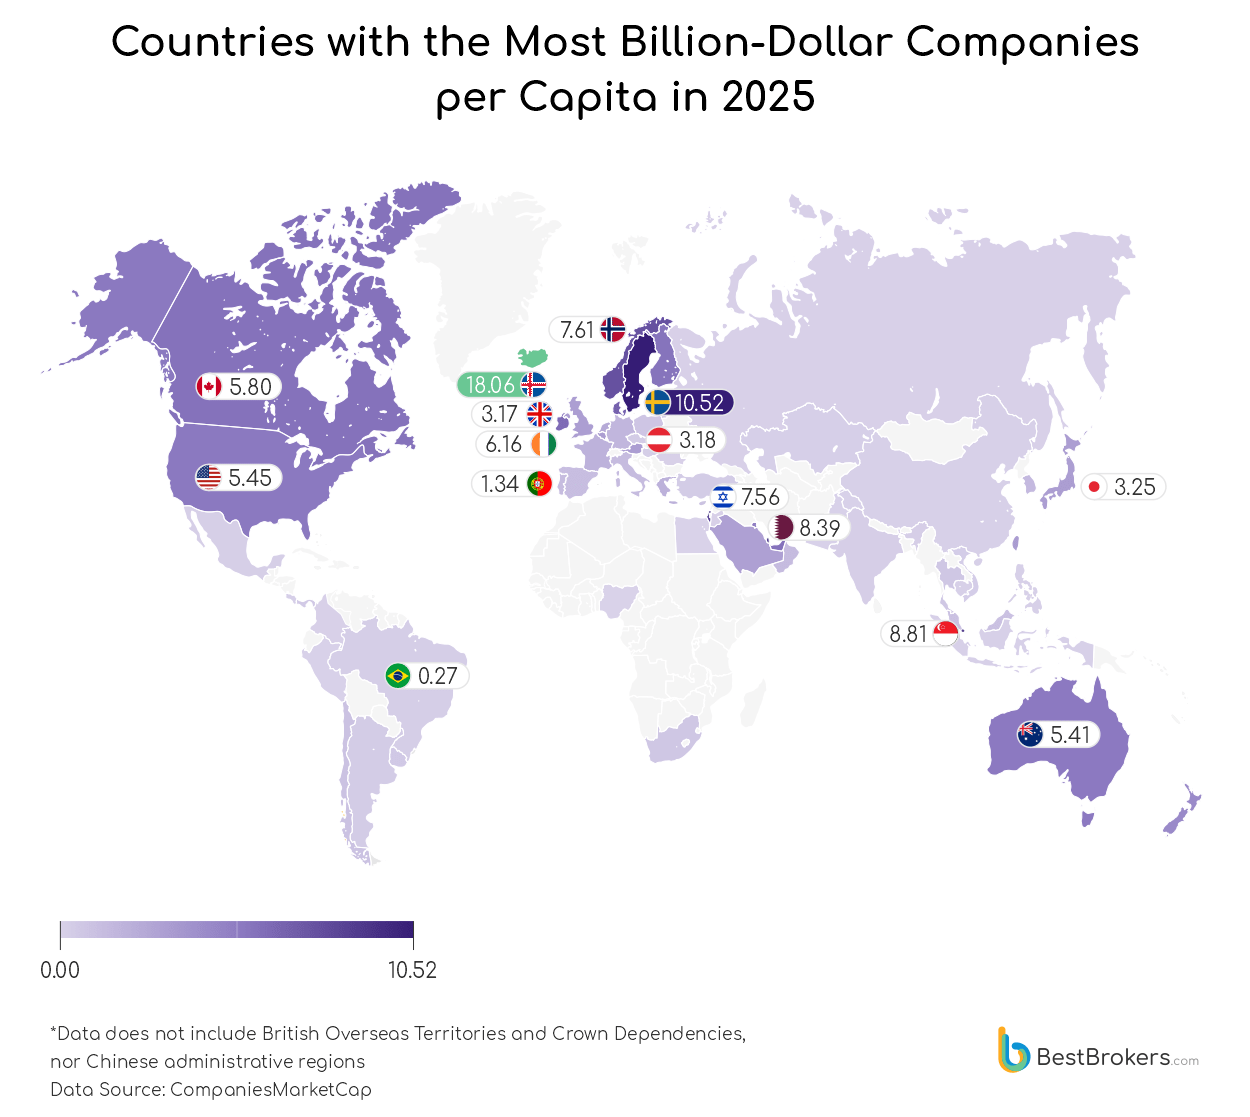
Monaco is home to only three publicly traded companies with a market capitalisation of $1 billion or more. Interestingly, they are all maritime transportation companies, providing and operating tankers, as well as dry cargo vessels. Due to Monaco’s tiny population of just under 40 thousand, however, its company per capita figure is the highest of all countries we looked at – 77 per 1 million citizens.
Similarly, Luxembourg, which along with Monaco, is one of Europe’s most notable microstates (because of both their territory and population size), has a huge number of billion-dollar companies per capita. With 21 companies and 665 thousand citizens, it has 31.6 businesses per million people. Iceland, which is significantly larger in size, however, also has a small population (387,558), and its 7 companies with a market cap of over a billion U.S. dollars place it 3rd on the list with 18.1 billion-dollar companies per million people.
If we look at larger nations, however, we can see that Western European and Scandinavian countries have some of the highest concentrations of large-cap companies. Switzerland ranks 4th with 13.8 companies per million citizens, followed by Sweden in the 5th place with 10.5 companies per million people. Norway ranks 8th with 7.6 businesses per million residents, while Denmark ranks 10th with 6.7 companies per million people.
Other notable countries with a high concentration of billion-dollar companies relative to their population are Singapore with 8.8 businesses per million people, Qatar (8.4 per million), and Israel (8.6 per million). Ireland ranks 11th with 6.2 companies per million residents, followed by the UAE (5.8 per million) and Canada (5.8 per million). The United States ranks 16th with 5.5 companies per million people, while Australia follows in the 17th place with 5.4 companies per million residents.
Other major economies appear lower on the ranking due to their larger populations; Japan ranks 21st with 3.2 companies per million people, the United Kingdom ranks 23rd with 3.2 businesses per million people, and Germany ranks 31st with 1.7 billion-dollar companies per million residents. Brazil ranks 51st with 0.3, followed by India with 0.2, while China ranks 56th with 0.15 companies per million people.
Methodology
To identify the countries with the most billion-dollar companies per capita, we first looked at the publicly listed companies from the company and stock tracking website CompaniesMarketCap. We selected those with a market value, also referred to as market capitalisation (or market cap) of at least 1 billion U.S. dollars, which gave us a total of 5,522 companies from 74 countries and territories.
In our calculations, we included only independent, sovereign states, meaning territories and areas belonging to China and the United Kingdom such as Hong Kong, Macao, or Bermuda, were excluded. The full list of excluded territories also features the Cayman Islands, which along with Bermuda, are among the several British Overseas Territories, and the Crown Dependencies of Jersey, Isle of Man, and Guernsey. Despite being self-governing, they belong to the Crown and cannot be considered sovereign states.
For the countries’ total area, we looked at the list of national territories (land plus water) from the CIA’s World Factbook. Data for the gross domestic product of countries for 2023 was sourced from the World Bank.
American Corporations Dominate with $57 Trillion in Combined Market Cap
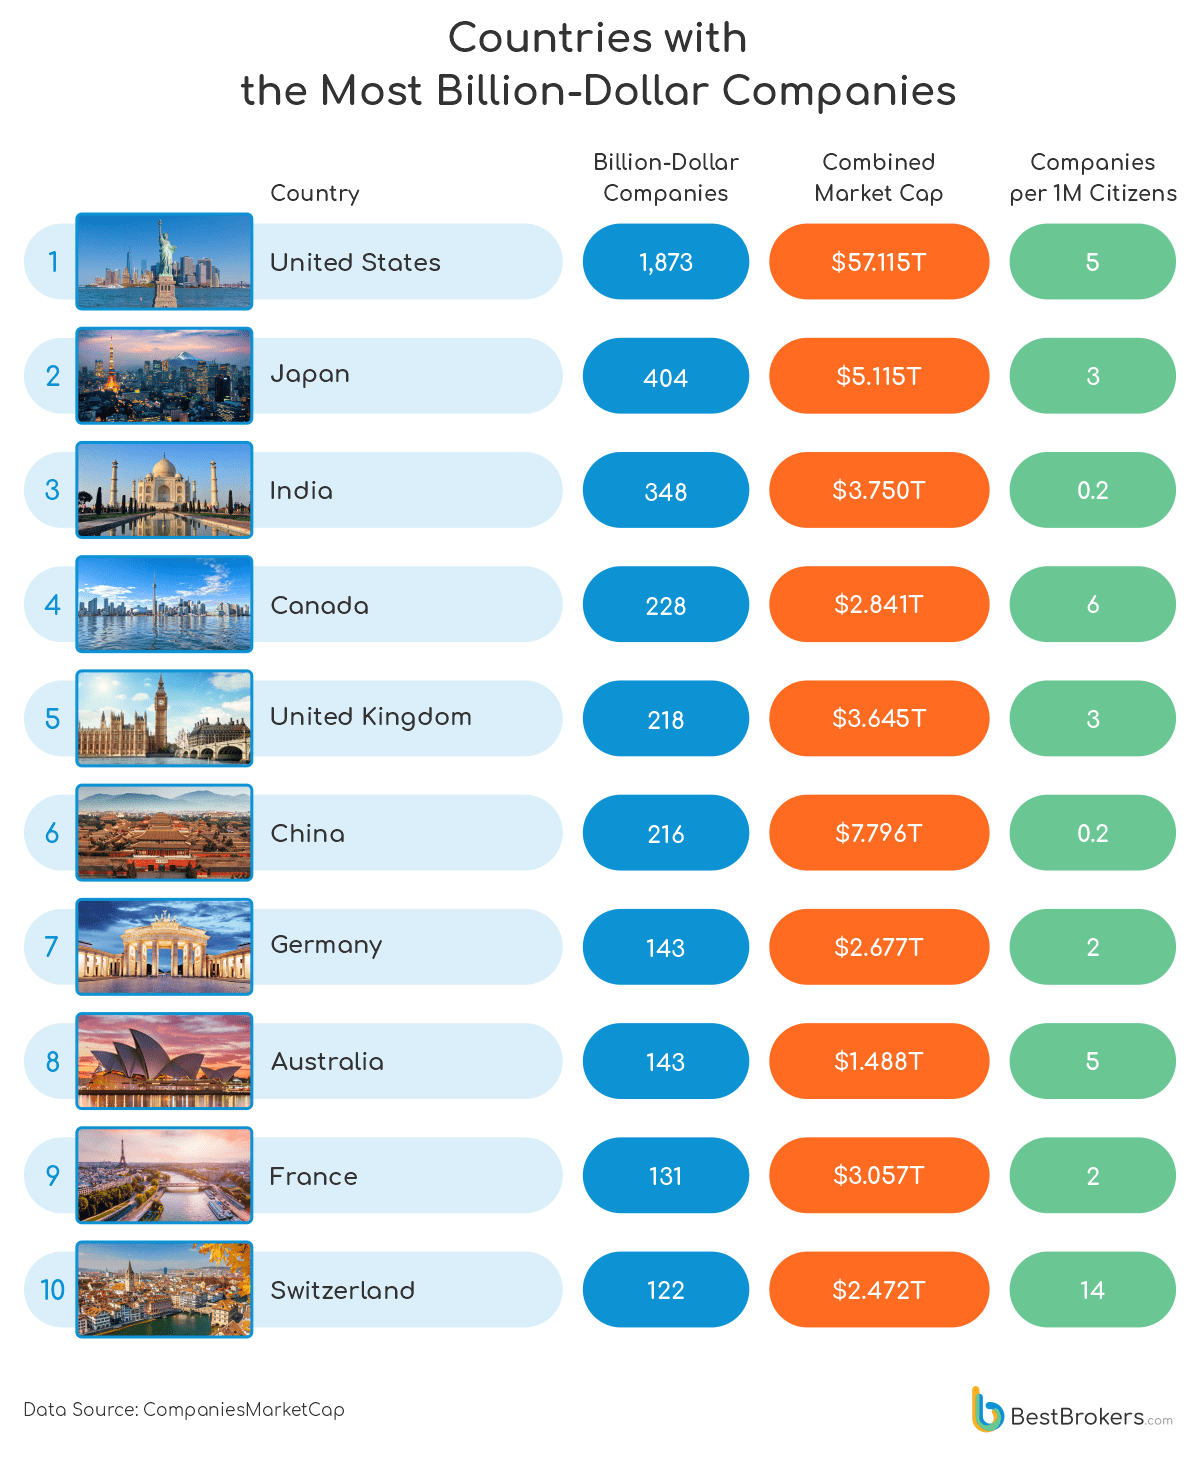
Out of all 5,522 public companies with a value of $1 billion or more, 1,873 are based in the United States. This means that one in every three billion-dollar companies around the world is American. A clear indication of the dominant role of these companies on the global markets is their combined market cap, a massive $57.115 trillion. This is more than the projected size of the entire U.S. economy for 2025, the largest one in the world with a nominal gross domestic product of $30.3 trillion for 2025. In 2023, the GDP was $27.7 trillion.
Tech giants, which have grown immensely over the past two decades, are among the largest players. Apple, Microsoft, NVIDIA, Meta, and Alphabet, along with the world’s largest retailer, Amazon, occupy the first places on the list and are expected to only increase their revenues and market share in the coming years. In fact, only two companies on the top 10 are not American, namely Saudi state oil producer Saudi Aramco and Taiwan’s semiconductor maker TSMC. If we take the top 20 largest companies, three are not based in the U.S. – along with Aramco and TSMC, the third one is China’s tech and gaming conglomerate, Tencent.
The Number of Billion-Dollar Companies Relative to the Size of a Country
It should not be fair to compare small countries and their businesses to the massive companies operating in large economies such as the United States. To level the playing field, we can calculate the concentration of large-cap companies not only relative to the size of the population of the country but also relative to its territory. A high concentration of large-cap companies in certain areas makes those regions magnets for global investment.
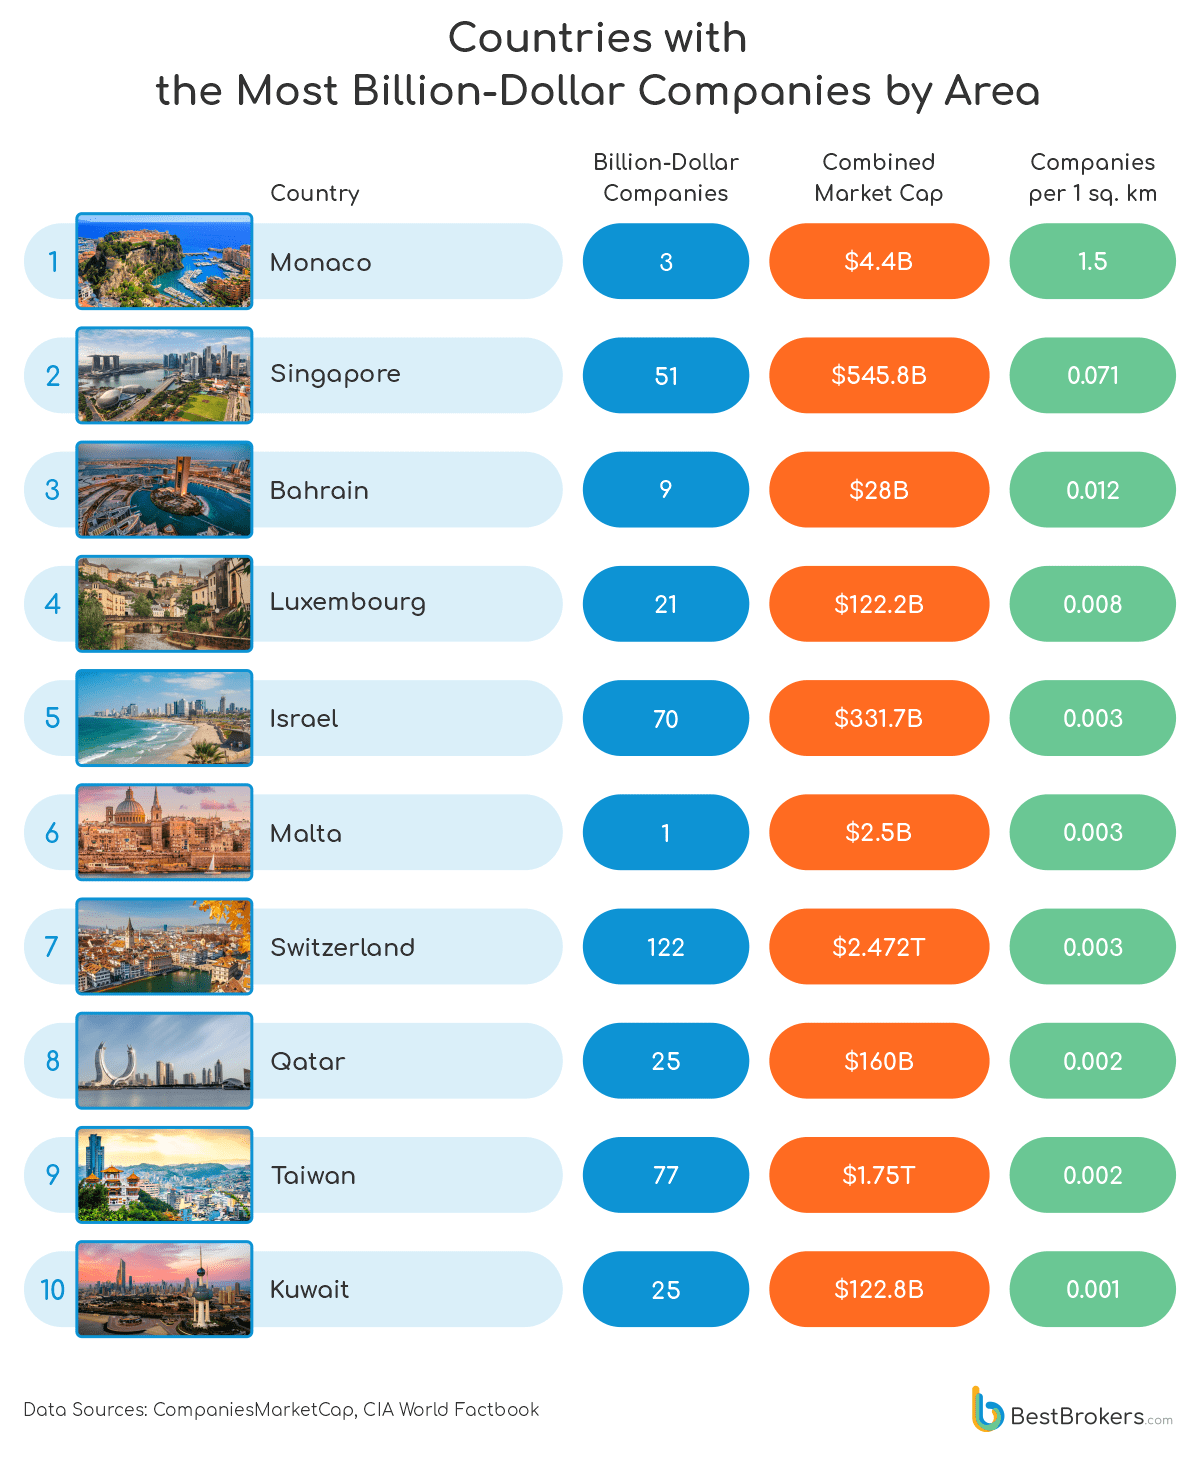
Several great examples of this can be seen in the list above, which ranks countries by the number of billion-dollar companies per 1 square kilometre of their territory. Monaco ranks first, followed by Singapore, Bahrain, and Luxembourg; all are small countries by size, yet they are investment hubs with competitive economies and strong regional influence.
As large corporations are clustered in specific areas, this can fuel innovation, drive economic growth and attract talent. At the same time, there is the risk of uneven distribution of opportunities and wealth, as well as the dangers of regions or entire regions relying on just a handful of large companies for their economic growth.
An example of this is Malta and the online gambling operator Kindred Group, which is the only billion-dollar company headquartered in the country. Its market value accounts for 11.13% of the gross domestic product of the country. The gambling industry is estimated to contribute roughly 12% of Malta’s GDP, showcasing the economy’s reliance on the sector.
Billion-Dollar Companies Relative to the Economy
The concentration of large-cap companies relative to a country’s entire economy is also an interesting way to look at corporations’ strength in a country. It can show the economic structure and the market efficiency, as well as the various risks from countries’ dependence on a few major corporations or a particular sector. Once again, it is a good indicator (along with others) of whether the economy is diversified or overeliant and vulnerable to market shocks.
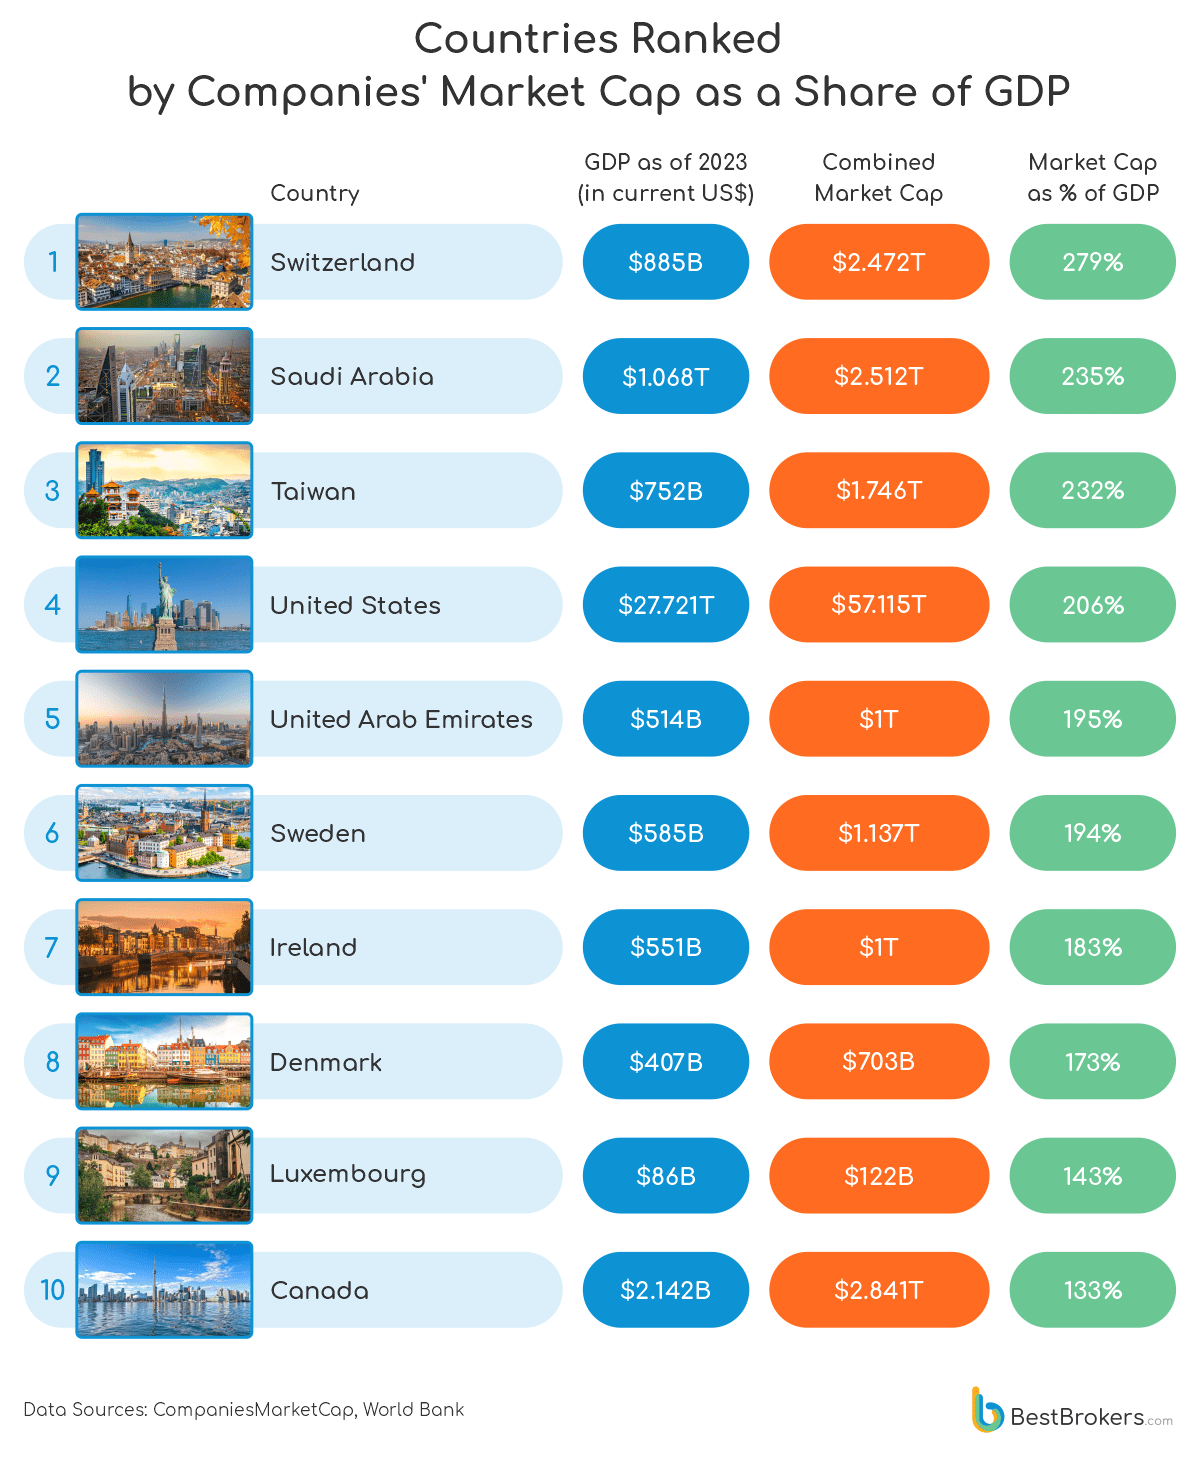
We calculated the combined market value of billion-dollar companies trading in every country as a percentage of these nations’ total output, i.e. their gross domestic product (GDP). This ratio is very similar to the so-called Buffett Indicator, which is used to assess the stock market.
What Is the Buffet Indicator?
It typically uses the total market capitalisation of all publicly traded companies within a country, which is then divided by the GDP. Higher ratios (above 120%-130%) suggest that the market is overvalued and a correction can be expected, whereas lower ratios (below 100%) show undervaluation of the companies and growth potential. It is similar to a price/sales valuation multiple but for an entire country, and it assesses markets by comparing them with a historical average.
Using this method but counting only the listed companies with a market cap of $1 billion or more, we found out that in several countries, the value of the top companies is more than double the total output of their economies. These are Switzerland, Saudi Arabia, Taiwan, and the United States where the combined market cap of the billion-dollar companies exceeds 200% of the GDP. Along with showing whether the aggregate market in a country is expensive or cheap, the indicator could be used to assess, along with other tools, how financialised an economy is. In other words, whether a country’s financial sector has increased in size and importance too much relative to its overall economy.
In highly financialised countries such as those we listed above, the economies have become dependent on financial activities and the growth of asset values. According to some economists, increased financialisation can make economies susceptible to crises such as the 2007-2008 financial crisis, which was related to, if not directly caused by, the greater importance of financial activities relative to non-financial economic activity and the use of overleverage and financial derivatives.
Final Thoughts
There is no single tool to showcase the importance and contributions of businesses to the economy. We can weigh by different metrics to make comparisons between countries but one thing is clear – absolute numbers favour the largest nations. This is why rankings such as billion-dollar companies per capita, by area or relative to the entire economy reveal different layers, different pictures of the same reality.
While the per-capita list showcases economies’ efficiency and potential for attracting talent and innovation, the concentration of billion-dollar companies by area can reveal how wealth, economic activity and opportunities are distributed over a territory. The list of companies’ aggregate capitalisation as а percentage of the GDP is also an interesting indicator, pointing to countries with well-developed financial sectors and stock markets.
However, it can also show the overreliance on financial services and the highly concentrated economies where a handful of massive corporations account for a significant portion of the total market. This is increasingly important at a time when most of the world’s wealth seems to be concentrated in the hands of just a few corporations and billionaires, while the middle class seems to be losing the assets it has earned over the past six or seven decades.