
Gold prices have surged to unprecedented levels, with spot gold briefly touching an all-time high of $4,381 per troy ounce in October, 2025. This marks a significant increase from earlier in the year, driven by a confluence of geopolitical tensions, economic uncertainties, and shifts in central bank policies. These conditions have reinforced gold’s appeal as a safe-haven asset, prompting central banks and investors to increase their holdings.
Central banks have been particularly active: a 2025 survey by the World Gold Council shows that 95% of central banks plan to expand their gold reserves over the coming year. India notably repatriated around 100 tonnes of gold from the U.K., reflecting a broader global trend of nations seeking to secure their gold reserves. In the United States, the market value of gold reserves has now surpassed $1 trillion for the first time, a dramatic increase from the book value recorded decades ago.
As analysts are projecting continued strength in gold prices through 2026, the BestBrokers team set out to research the demand for gold by central banks in 2025 so far. We gathered the latest data from the World Gold Council (WGC) and identified the countries that increased their gold reserves the most since January 2025, as well as those nations that sold the most of the precious metal.
Countries building their gold reserves in 2025
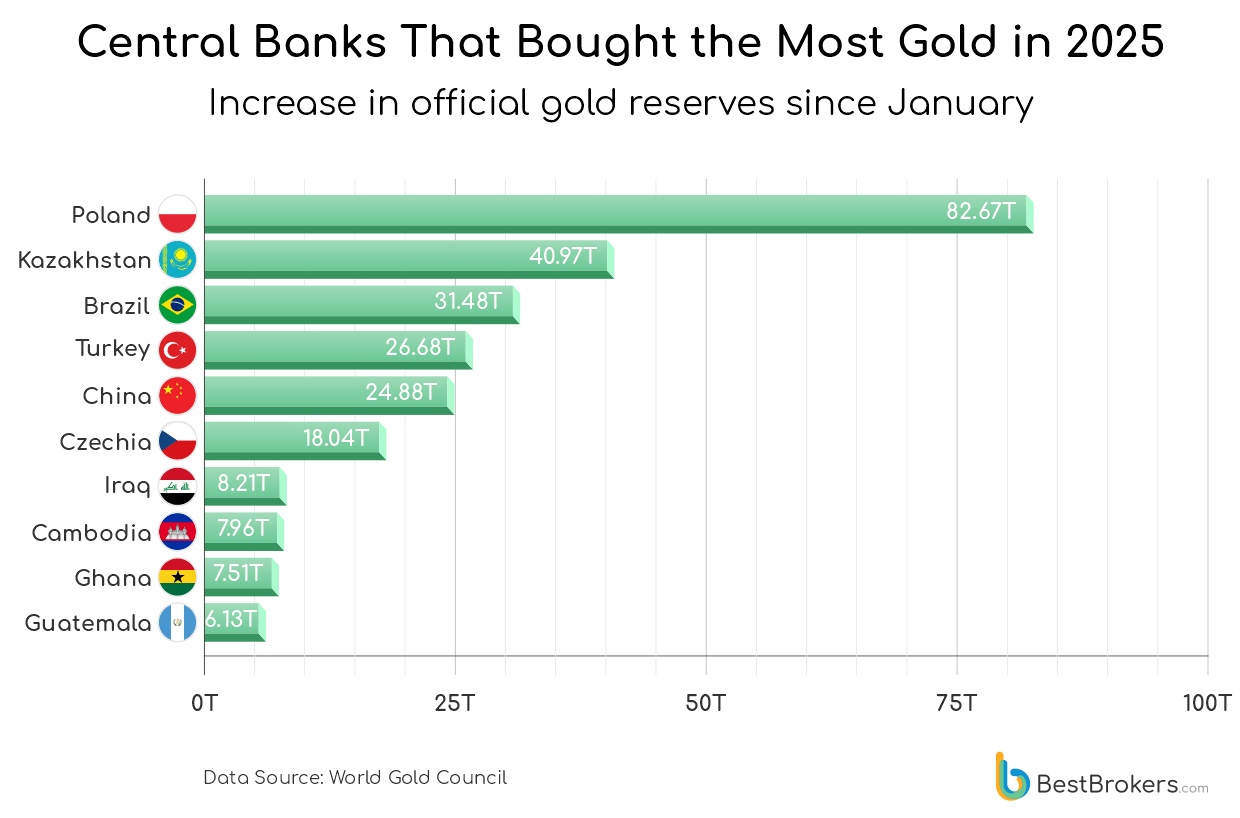
In 2025, several countries continued to expand their gold reserves, though at a slower pace than the record levels seen in 2024. Poland led the way with net purchases of 82.67 tonnes, only 7.6% less than the 89.5 tonnes it added the previous year, and data for December purchases is still not available, thus, there is still a possibility for the country to top the quantity it bought last year. The National Bank of Poland’s strategy remains shaped by persistent geopolitical uncertainty, especially the ongoing fallout from Russia’s war in Ukraine, which has kept security concerns front and centre. Record-high gold prices in 2025 appear not to have tempered the scale of new buying since a purchase of 15.6 tonnes was made in October. As of December 2025, Poland holds 530.90 tonnes of gold, accounting for roughly 25.6% of its total reserves, and placing it 12th in the world for official gold holdings.
Kazakhstan, Brazil, and China also expanded their gold reserves this year. Kazakhstan added 40.97 tonnes in 2025, a notable reversal after selling 10.2 tonnes in 2024, pointing to a renewed commitment to gold as a strategic asset. Brazil remained quiet in the gold market for nearly all of 2025, only to re-enter aggressively with notable purchases in September and October, each exceeding 15 tonnes. Its year-to-date increase now stands at 31.48 tonnes. China, meanwhile, continued its steady accumulation, purchasing 24.88 tonnes on top of the 44.2 tonnes it added in 2024. This brings China’s official holdings to more than 2,300 tonnes, cementing its position as the world’s sixth-largest gold holder.
After a substantial 77.4-tonne increase in 2024, Turkey continued to add to its reserves in 2025 with purchases of 26.68 tonnes. The pace, however, has slowed compared with its more aggressive buying in 2022 (147.6 tonnes) and a modest reduction in 2023 (-1.6 tonnes). Beyond the major players, other notable buyers so far in 2025 include the Czech Republic, Iraq, Cambodia, Ghana, and Guatemala, all of which secured a place among the year’s top 10 gold purchasers.
Indonesia, Qatar, the Kyrgyz Republic, Serbia and India also made purchases in 2025, each adding between 4 and 5 tonnes so far this year. The Kyrgyz Republic’s contribution (4.25 tonnes) marks a sharp drop from the 16.6 tonnes it acquired in 2024. Meanwhile, Bulgaria joined the group of buyers for the first time in several years, adding 2.05 tonnes ahead of its planned adoption of the euro in 2026, a move that typically prompts countries to strengthen and rebalance their reserve composition.
The State Oil Fund of the Republic of Azerbaijan (SOFAZ) boosted its gold holdings by 38.20 tonnes in 2025, making it the third-largest single addition of the year after Poland and Kazakhstan. Unlike the central bank, which does not report any gold reserves and therefore is not included in official rankings of net buyers, SOFAZ manages the country’s oil and gas revenues and has treated gold as a strategic portfolio asset since 2012. Since then, the fund has steadily built its position, accumulating 184.8 tonnes.
What has been driving gold’s rally?
Geopolitical tensions, persistent inflation, and, more recently, a weakening dollar remain the key drivers of central banks’ and investors’ demand for gold. The U.S. dollar index (DXY) slipped below 103 in late September, its lowest since early June, as markets priced in Federal Reserve rate cuts. The shift in U.S. trade policy under President Donald Trump, particularly renewed tariffs and a tougher stance on global trade, has further pressured the dollar and reinforced gold’s safe-haven appeal.
Since the beginning of 2025, the SPDR Gold Shares ETF (GLD), which tracks gold prices, has experienced a year-to-date return of approximately 59.96% as of December 10, 2025. Over the past twelve months, the fund has gained about 57.48%, reflecting gold’s sharp upward trajectory amid economic and political uncertainty.
Analysts at major banks have been forced to revise forecasts upward. Citigroup compared gold’s performance to the ‘art market’, highlighting demand less tied to traditional fundamentals, while Deutsche Bank lifted its year-end target to $4,000 per ounce. Earlier projections that gold could breach $3,000 by the end of 2025 were realised much sooner than expected; the metal broke that threshold in March and soared past $3,800 in September, setting fresh all-time highs.
Countries with a drop in gold reserves in 2025
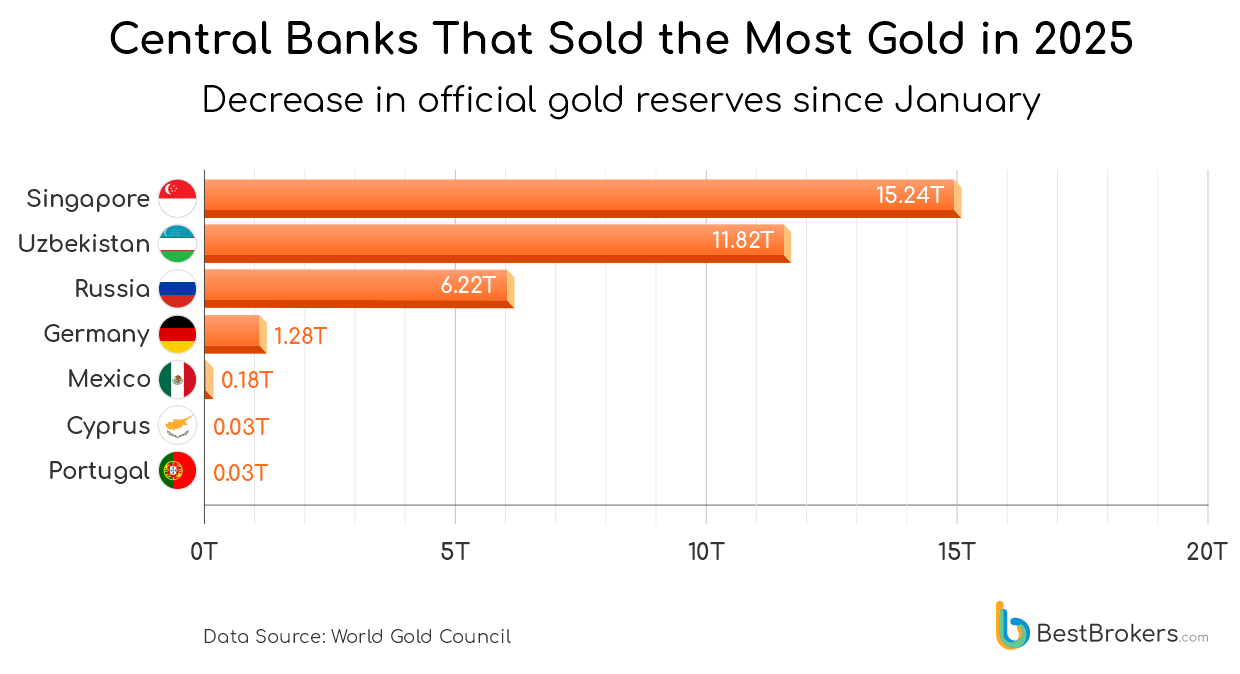
In an unexpected trend, several central banks made substantial reductions in their gold reserves in 2025, with Singapore at the forefront. Recent data indicates that multiple countries have chosen to sell some of their gold holdings, likely in response to economic pressures, financial restructuring, or to ensure liquidity in volatile markets. Another reason why some chose to sell gold was last year’s impressive gold rally, seeing the price of the precious metal climbing by $1,195.35 (approximately 45.4%) from $2,629.95 on 30 September 2024 to $3,825.30 on 30 September 2025.
Singapore consistently reduced its gold reserves throughout 2025, starting in March with a sale of 4.85 tonnes, followed by 5.38 tonnes in May, 5.60 tonnes in June, and around 591 kilograms in September, bringing total disposals for the year to 15.24 tonnes. This represents a clear shift from its earlier accumulation trend: after being largely inactive for decades, Singapore bought 26.3 tonnes in 2021 and 76.3 tonnes in 2023, then sold 10.1 tonnes in 2024.
Despite these official sales, the city-state has emerged as a major hub for private gold storage, attracting the ultra-wealthy seeking a safe jurisdiction amid global economic and geopolitical uncertainty. Facilities such as The Reserve have seen soaring demand, with orders to store physical gold and silver increasing sharply in early 2025, reflecting Singapore’s reputation as the ‘Geneva of the East’ and a preferred destination for investors seeking secure, non-bank storage.
In 2025, the Central Bank of Uzbekistan bought and sold gold as part of its standard banking operations, as all central banks do. However, its sales exceeded purchases, leading to a net decrease in official gold reserves of 11.82 metric tonnes. These transactions make Uzbekistan the largest net gold seller this year, signalling a strategic shift in how it manages its reserves. The Central Bank primarily purchases gold from international bullion markets, including major exchanges in London and Zurich, and while it generally retains part of its purchases in reserves, it occasionally sells varying amounts to take advantage of higher market prices.
Russia reduced its gold holdings by 6.22 metric tonnes in 2025, following 17 consecutive years of purchases until 2023, when it reported no changes for two consecutive years. The country now holds 2,327 tonnes of gold bars and coins, accounting for 41.70% of its total reserves, making it the fifth-largest official holder of gold in the world.
Germany holds one of the world’s largest gold reserves, second only to the United States. In 2025, it reduced this amount by 1.28 tonnes, bringing its total holdings to 3,350.25 tonnes. The country has been drawing from its gold reserves consistently for decades; WGC data show Germany has lowered its holdings every year since at least 2002 (the latest available data), often through regular exports to the UK. Last year’s sale of 1.1 tonnes was the smallest annual reduction on record.
Other countries that reduced their gold reserves in 2025 include Mexico, Cyprus, and Portugal, although their net sales remain modest, under a tonne each. Mexico showed minimal changes in 2023 and 2024, adding just 0.1 and 0.2 tonnes, respectively, and so far this year, Banco de México has reduced its holdings by about 180 kilograms. Cyprus and Portugal, on the other hand, released small amounts this year, around 30 kilograms each, possibly reflecting minor portfolio rebalancing, liquidity needs, or a strategic shift in reserve allocation in response to broader market conditions.
Central banks with the largest gold reserves as of December 2025
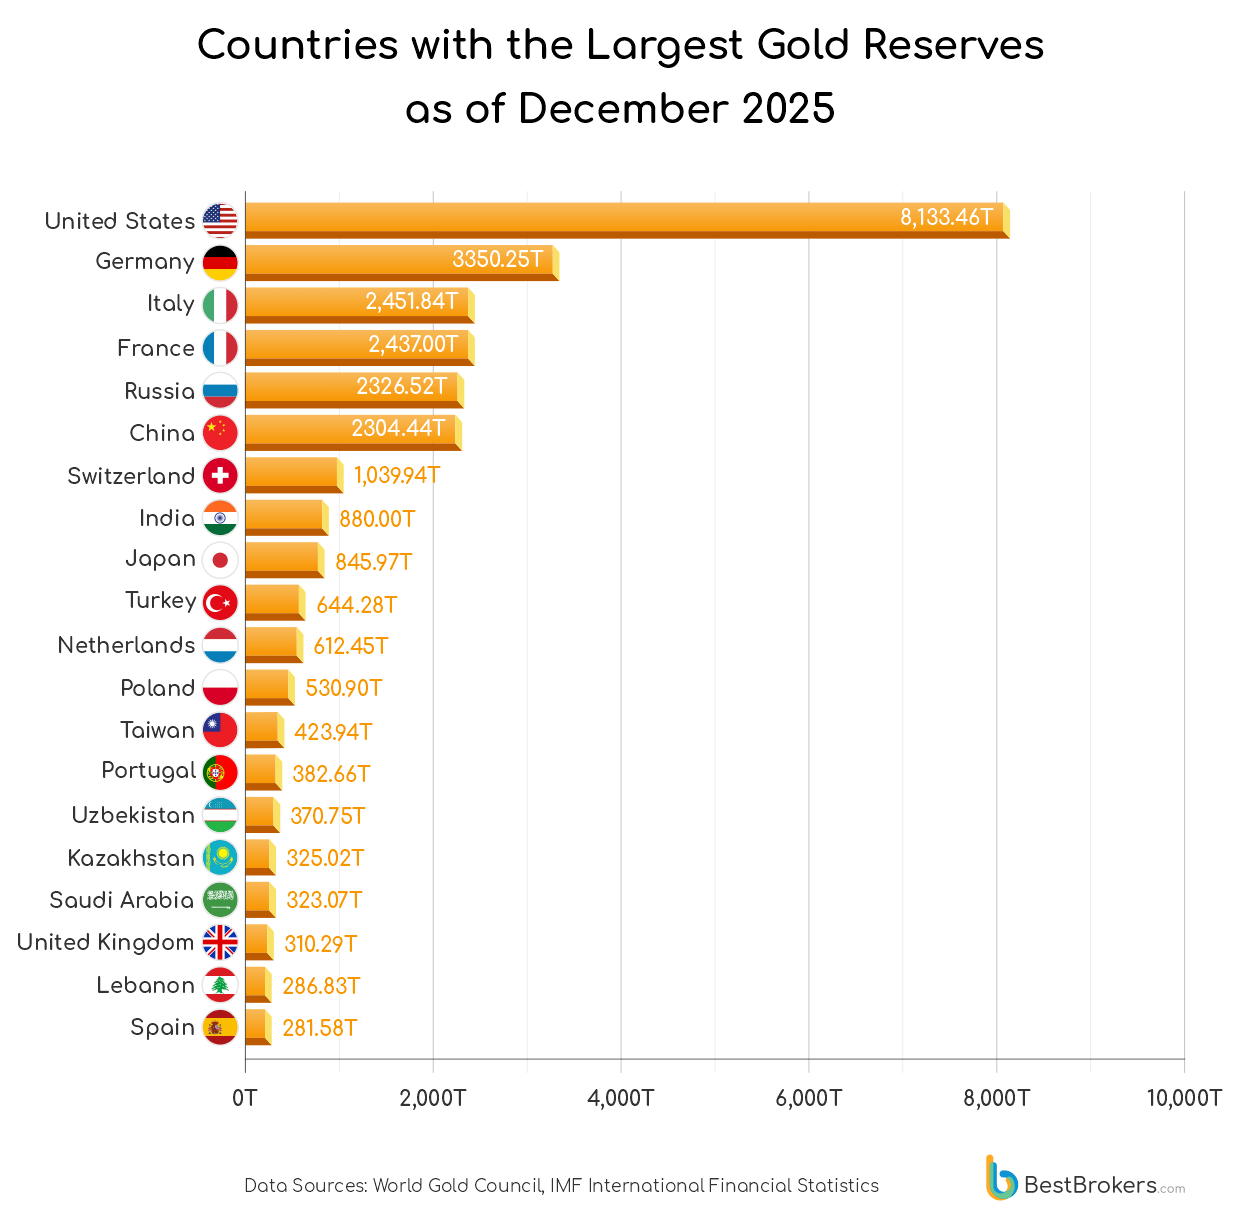
As the value of various currencies fluctuates, the price of gold has remained strong this year, driving demand from both investors and central banks. The nation holding the largest official gold reserve remains the United States, with 8,133.46 tonnes, accounting for 81.10% of its total foreign reserves. Germany and Italy follow, holding 3,350.25 tonnes and 2,451.84 tonnes, respectively.
Other countries with substantial gold reserves include France, which holds 2,437 tonnes, and the Russian Federation, with 2,326.52 tonnes. China, Switzerland, India, Japan, and Turkey also have significant holdings: China possesses 2,304.44 tonnes, while Switzerland holds nearly 1,040 tonnes. Although India, Japan, and Turkey each have less than a thousand tonnes, together they account for roughly 3% of global official gold reserves. It should be noted, however, that not all nations report their gold holdings to the International Monetary Fund (IMF), so actual totals may differ slightly. The top ten largest national gold reserves hold 74.6% of all the gold in banks’ possession, while the top five countries have 57%.
Nations’ gold reserves per capita as of December 2025
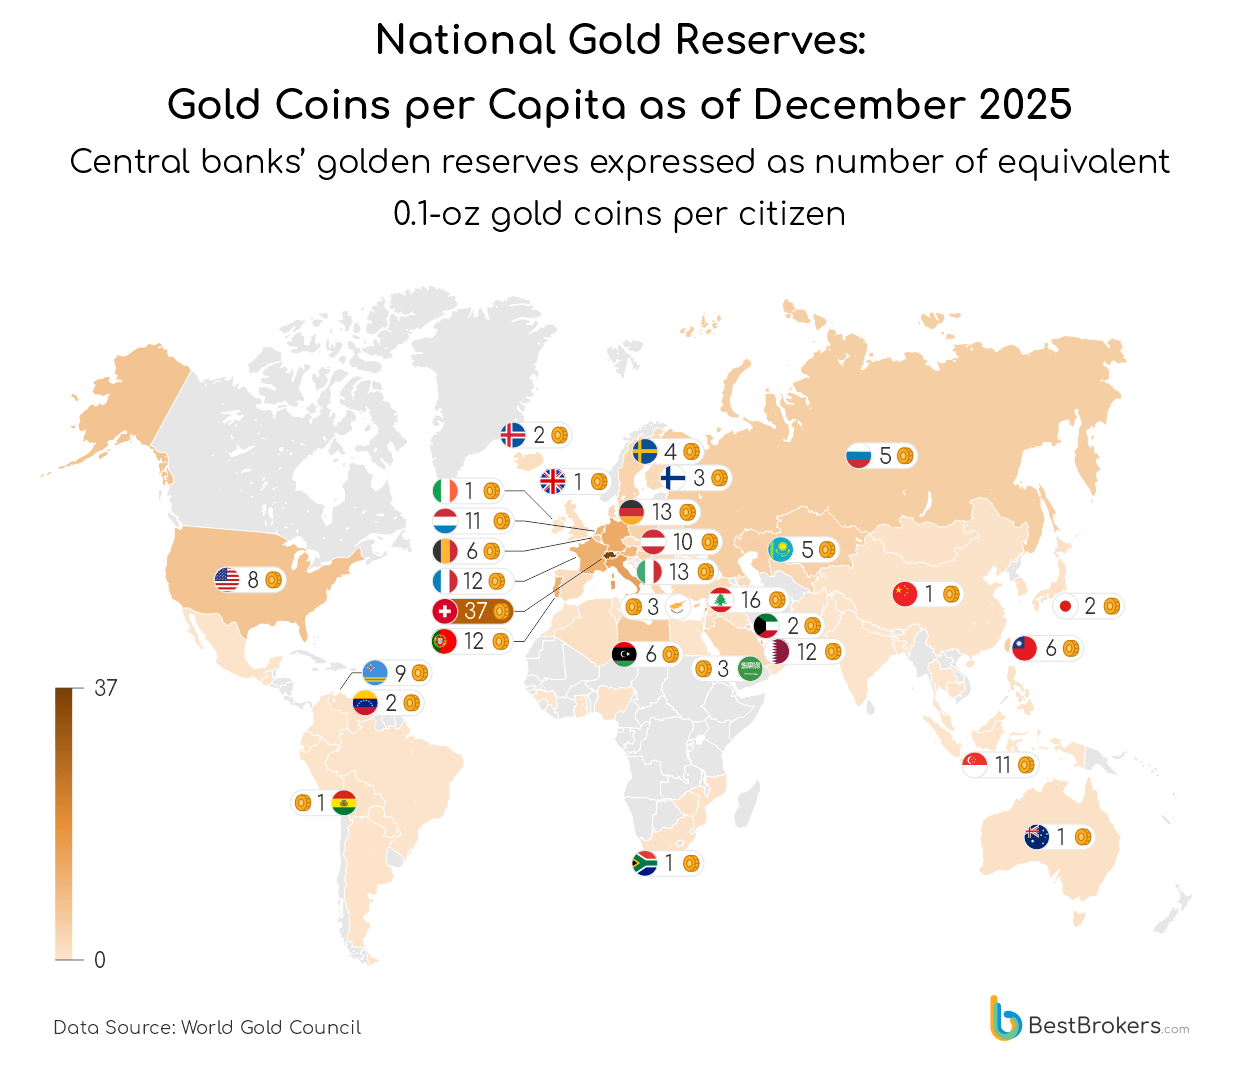
Despite some countries stockpiling impressive total reserves, their per capita gold holdings can tell a different story, as they do provide a useful way to compare the relative gold wealth of large and small economies.
The United States, despite holding the largest total gold reserves, ranks only 12th in gold per capita, with 23.4 grams per citizen. This is equivalent to 0.75 troy ounces of gold per person, or nearly eight small gold coins. The coins used in this comparison contain 0.1 troy ounces of gold and weigh approximately 0.11 troy ounces (3.39 g).
Switzerland, by contrast, holds the seventh-largest gold reserve in the world. When its population of approximately 9 million is taken into account, it ranks first in gold per capita, with nearly 116 grams (3.7 troy ounces) per person. In other words, each Swiss citizen could theoretically possess about 37 small gold coins, the highest per capita total of any nation.
Lebanon ranks second in gold per capita, with roughly 16 small gold coins per person, followed by Italy and Germany, each holding about 13 one-tenth-ounce coins per citizen. This is notable, as neither country has significantly increased its gold reserves for decades. Qatar also ranks high, with 115.2 tonnes of gold, equivalent to about 12 coins per citizen, alongside the reserves of Portugal (382.66 tonnes) and France (2,437 tonnes), each similarly translating to roughly 12 coins per person.
Other nations with notable gold per capita include Singapore and the Netherlands, each with about 11 gold coins per person, while Austria follows closely with 10 coins per individual. Ranking 11th in this metric is the Caribbean island of Aruba, which, with 3.11 tonnes of gold and a population of 108,000, surpasses the United States in per capita gold holdings.
2025 global gold demand overview
In the first half of 2025, several countries significantly expanded their gold reserves through large-scale purchases.
Poland remained a leading buyer of gold in 2025, adding 48.6 tonnes in Q1 and a further 18.6 tonnes in Q2, bringing its first-half total to 67.2 tonnes. A significant purchase of 15.56 tonnes in October raised its year-to-date total to 82.67 tonnes, nearly matching last year’s total and with potential to surpass it once November and December figures are released. Poland’s proximity to the Russia-Ukraine conflict likely underpins the continued accumulation, as the central bank accelerates purchases despite elevated prices. Whether it will exceed the 130 tonnes acquired in 2023 remains uncertain.
Azerbaijan also made notable moves in 2025, with its State Oil Fund (SOFAZ) acquiring 18.7 tonnes in March, 15.8 tonnes in June, and 3.7 tonnes in September, bringing the year-to-date total to 38.2 tonnes. Meanwhile, China added 12.8 tonnes in Q1 and a further 6.3 tonnes in Q2, reaching 21 tonnes by mid-year. According to the latest data, they currently stand at 24.88 tonnes, making it unlikely to surpass the 44.2 tonnes purchased in 2024, and still far from the 224.9 tonnes acquired in 2023.
Kazakhstan, after being a net seller in 2024, reversed course in 2025, acquiring 6.4 tonnes in Q1 and 18.3 tonnes in Q2, bringing the mid-year total to 24.7 tonnes. In August, it sold 7.7 tonnes, followed by 7.9 tonnes in September and 657 kilograms in October, raising the year-to-date total to 40.97 tonnes. This sharp turnaround suggests a deliberate reserve-building strategy, likely driven by rising gold prices and regional economic pressures.
A surprising entrant in the 2025 gold buying spree is Brazil, which remained inactive for most of the year before making two substantial purchases in September and October, each exceeding 15 tonnes, bringing its year-to-date total to 31.48 tonnes. Analysts note that the purchases reflect a deliberate strategy to diversify away from the U.S. dollar and U.S. Treasuries. Brazil’s re-entry into the gold market points to the broader trend of central banks increasing gold holdings as a hedge against currency volatility, echoing patterns seen across BRICS+ countries. Its activity has drawn market attention, given the country’s influence within the BRICS alliance, and highlights gold’s ongoing appeal as a safe-haven asset even as prices have surged above $4,000 an ounce in 2025.
On the selling side, Uzbekistan led for most of 2025 until October, when Singapore unexpectedly overtook it with 15.24 tonnes sold, 4 tonnes more than Uzbekistan’s total of 11.82. This reversal highlights Singapore’s strategic reserve adjustment after years of heavy accumulation, suggesting a deliberate approach to balance official holdings while catering to strong private demand for vaulted gold amid global economic and geopolitical uncertainty.
Who does not own any gold?
Despite being one of the world’s top gold-mining nations, Canada is among the very few countries that hold no gold in their official reserves. The Bank of Canada fully sold off its bullion holdings over the past two decades and today reports 0 tonnes of gold as part of its international reserves. This decision reflects a longstanding policy view that U.S. Treasury securities and other highly liquid assets are better suited for reserve management than gold, which former deputy governor Timothy Lane once described as not fitting Canada’s ‘asset-matching framework’.
Norway is another notable example. During World War II, its central bank evacuated about 50 tonnes of gold to the United Kingdom and the United States to support the government-in-exile. After the war, parts of the hoard were returned, but in 2004, Norges Bank announced the sale of nearly all of its remaining bullion, keeping only seven bars and some coins for historical and exhibition purposes. Today, Norway officially reports 0 tonnes of gold in its reserves.
These cases stand in sharp contrast to most other advanced economies, where gold continues to represent a significant share of central bank reserves. They highlight that not all major economies consider the precious metal essential to reserve strategy, even countries with large mining industries like Canada or with historical stockpiles like Norway.
| National Gold Reserves: Gold Coins per Capita as of December 2025 | |||||||
|---|---|---|---|---|---|---|---|
| Country | Population 2025 | Gold Holdings | Share of Total Reserves | Holdings as of | Gold Holdings in Troy Ounces | Gold per Capita, gram per person | Gold per Capita, ounce per person |
| United States | 347,276,000 | 8,133.46 | 81.10% | Sep 2025 | 261,496,865 | 23.42 | 0.75 |
| Germany | 84,075,100 | 3,350.25 | 81.20% | Oct 2025 | 107,713,151 | 39.85 | 1.28 |
| Italy | 59,146,300 | 2,451.84 | 78.30% | Oct 2025 | 78,828,379 | 41.45 | 1.33 |
| France | 66,650,800 | 2,437.00 | 78.60% | Oct 2025 | 78,351,382 | 36.56 | 1.18 |
| Russian Federation | 143,997,000 | 2,326.52 | 41.70% | Oct 2025 | 74,799,410 | 16.16 | 0.52 |
| China, P.R.: Mainland | 1,416,100,000 | 2,304.44 | 8.00% | Oct 2025 | 74,089,416 | 1.63 | 0.05 |
| Switzerland | 8,967,410 | 1,039.94 | 12.60% | Sep 2025 | 33,434,736 | 115.97 | 3.73 |
| India | 1,463,870,000 | 880.18 | 16.20% | Oct 2025 | 28,298,444 | 0.60 | 0.02 |
| Japan | 123,103,000 | 845.97 | 8.10% | Oct 2025 | 27,198,666 | 6.87 | 0.22 |
| Turkey | 87,685,400 | 644.28 | 50.80% | Oct 2025 | 20,713,967 | 7.35 | 0.24 |
| The Netherlands | 18,346,800 | 612.45 | 71.80% | Oct 2025 | 19,690,845 | 33.38 | 1.07 |
| Poland | 38,140,900 | 530.90 | 25.60% | Oct 2025 | 17,068,847 | 13.92 | 0.45 |
| Taiwan | 23,112,800 | 423.94 | 8.30% | Sep 2025 | 13,629,893 | 18.34 | 0.59 |
| Portugal | 10,411,800 | 382.66 | 77.70% | Oct 2025 | 12,302,903 | 36.75 | 1.18 |
| Uzbekistan | 37,053,400 | 370.75 | 80.60% | Oct 2025 | 11,919,906 | 10.01 | 0.32 |
| Kazakhstan | 20,843,800 | 325.02 | 69.00% | Oct 2025 | 10,449,794 | 15.59 | 0.50 |
| Saudi Arabia | 34,566,300 | 323.07 | 8.50% | Sep 2025 | 10,386,859 | 9.35 | 0.30 |
| United Kingdom | 69,551,300 | 310.29 | 19.10% | Oct 2025 | 9,975,962 | 4.46 | 0.14 |
| Lebanon | 5,849,420 | 286.83 | 79.00% | Mar 2025 | 9,221,927 | 49.04 | 1.58 |
| Spain | 47,890,000 | 281.58 | 29.20% | Oct 2025 | 9,052,929 | 5.88 | 0.19 |
| Austria | 9,113,570 | 279.99 | 72.80% | Oct 2025 | 9,001,929 | 30.72 | 0.99 |
| Thailand | 71,619,900 | 234.52 | 11.10% | Oct 2025 | 7,539,941 | 3.27 | 0.11 |
| Belgium | 11,758,600 | 227.40 | 55.30% | Oct 2025 | 7,310,942 | 19.34 | 0.62 |
| Singapore | 5,870,750 | 204.72 | 6.40% | Oct 2025 | 6,581,948 | 34.87 | 1.12 |
| Azerbaijan | 10,397,700 | 184.80 | 32.40% | Sep 2025 | 5,941,458 | 17.77 | 0.57 |
| Algeria | 47,435,300 | 173.56 | 27.50% | Jul 2025 | 5,579,956 | 3.66 | 0.12 |
| Iraq | 47,020,800 | 170.85 | 22.10% | Sep 2025 | 5,492,957 | 3.63 | 0.12 |
| Venezuela | 28,516,900 | 161.22 | 91.50% | Jun 2018 | 5,183,359 | 5.65 | 0.18 |
| Brazil | 212,812,000 | 161.13 | 5.80% | Oct 2025 | 5,180,421 | 0.76 | 0.02 |
| Libya | 7,476,747 | 146.65 | 18.30% | Sep 2025 | 4,714,963 | 19.61 | 0.63 |
| Philippines | 117,017,380 | 132.50 | 15.50% | Oct 2025 | 4,259,966 | 1.13 | 0.04 |
| Egypt | 118,366,000 | 128.84 | 34.90% | Oct 2025 | 4,142,307 | 1.09 | 0.03 |
| Sweden | 10,656,600 | 125.72 | 22.50% | Oct 2025 | 4,041,968 | 11.80 | 0.38 |
| South Africa | 64,747,300 | 125.50 | 22.60% | Oct 2025 | 4,034,968 | 1.94 | 0.06 |
| Mexico | 131,947,000 | 120.12 | 6.00% | Oct 2025 | 3,861,818 | 0.91 | 0.03 |
| Qatar | 3,115,890 | 115.97 | 26.60% | Sep 2025 | 3,728,647 | 37.22 | 1.20 |
| Greece | 9,938,840 | 114.68 | 65.20% | Oct 2025 | 3,686,971 | 11.54 | 0.37 |
| Hungary | 9,632,290 | 110.01 | 25.40% | Oct 2025 | 3,536,972 | 11.42 | 0.37 |
| Korea | 51,667,000 | 104.45 | 3.10% | Sep 2025 | 3,358,042 | 2.02 | 0.06 |
| Romania | 18,908,600 | 103.63 | 15.00% | Oct 2025 | 3,331,674 | 5.48 | 0.18 |
| Indonesia | 285,721,000 | 84.29 | 7.30% | Oct 2025 | 2,709,979 | 0.30 | 0.01 |
| Australia | 26,974,000 | 79.87 | 15.30% | Oct 2025 | 2,567,980 | 2.96 | 0.10 |
| Kuwait | 5,026,080 | 78.98 | 19.40% | Sep 2025 | 2,539,148 | 15.71 | 0.51 |
| United Arab Emirates | 11,346,000 | 74.91 | 3.60% | Aug 2025 | 2,408,289 | 6.60 | 0.21 |
| Jordan | 11,520,700 | 72.54 | 37.30% | Aug 2025 | 2,332,129 | 6.30 | 0.20 |
| Czech Republic | 10,609,200 | 69.21 | 5.20% | Oct 2025 | 2,225,263 | 6.52 | 0.21 |
| Denmark | 6,002,510 | 66.55 | 6.50% | Oct 2025 | 2,139,583 | 11.09 | 0.36 |
| Pakistan | 255,220,000 | 64.76 | 34.60% | Oct 2025 | 2,082,030 | 0.25 | 0.01 |
| Argentina | 45,851,400 | 61.74 | 20.10% | Oct 2025 | 1,984,947 | 1.35 | 0.04 |
| Cambodia | 17,848,000 | 54.43 | 26.70% | Oct 2025 | 1,749,939 | 3.05 | 0.10 |
| Belarus | 8,997,600 | 53.90 | 51.10% | Sep 2025 | 1,732,986 | 5.99 | 0.19 |
| Serbia | 6,689,040 | 52.16 | 19.80% | Oct 2025 | 1,676,852 | 7.80 | 0.25 |
| Finland | 5,623,330 | 43.76 | 26.30% | Oct 2025 | 1,406,989 | 7.78 | 0.25 |
| Bulgaria | 6,714,560 | 42.93 | 11.60% | Oct 2025 | 1,380,089 | 6.39 | 0.21 |
| Kyrgyz Rep. | 7,295,030 | 42.38 | 69.10% | Oct 2025 | 1,362,462 | 5.81 | 0.19 |
| Malaysia | 35,977,800 | 38.88 | 4.00% | Oct 2025 | 1,249,990 | 1.08 | 0.03 |
| Ghana | 35,064,300 | 38.04 | 58.10% | Oct 2025 | 1,223,014 | 1.08 | 0.03 |
| Peru | 34,576,700 | 34.67 | 5.40% | Jul 2021 | 1,114,671 | 1.00 | 0.03 |
| Slovak Rep. | 5,474,880 | 31.69 | 22.90% | Oct 2025 | 1,018,992 | 5.79 | 0.19 |
| Ukraine | 38,980,400 | 27.37 | 7.10% | Oct 2025 | 879,993 | 0.70 | 0.02 |
| Ecuador | 18,289,900 | 26.28 | 39.90% | Sep 2025 | 844,956 | 1.44 | 0.05 |
| Syrian Arab Republic | 25,620,400 | 25.80 | 16.60% | Jun 2011 | 829,489 | 1.01 | 0.03 |
| Bolivia | 12,581,800 | 22.50 | 95.10% | Apr 2025 | 723,385 | 1.79 | 0.06 |
| Morocco | 38,430,800 | 22.12 | 6.20% | Sep 2025 | 711,073 | 0.58 | 0.02 |
| Afghanistan | 43,844,100 | 21.87 | 25.50% | May 2021 | 703,003 | 0.50 | 0.02 |
| Nigeria | 237,528,000 | 21.44 | 6.40% | Sep 2025 | 689,313 | 0.09 | 0.00 |
| Bangladesh | 175,687,000 | 14.28 | 6.70% | Oct 2025 | 459,160 | 0.08 | 0.00 |
| Cyprus | 1,370,750 | 13.87 | 64.30% | Oct 2025 | 445,996 | 10.12 | 0.33 |
| Guatemala | 18,687,900 | 13.02 | 5.30% | Oct 2025 | 418,597 | 0.70 | 0.02 |
| Mauritius | 1,268,280 | 12.42 | 16.90% | Oct 2025 | 399,197 | 9.79 | 0.31 |
| Ireland | 5,308,040 | 12.04 | 11.70% | Oct 2025 | 386,997 | 2.27 | 0.07 |
| Mongolia | 3,517,100 | 7.64 | 16.60% | Sep 2025 | 245,504 | 2.17 | 0.07 |
| Tajikistan | 10,786,700 | 7.42 | 20.00% | Feb 2023 | 238,406 | 0.69 | 0.02 |
| Georgia | 3,806,670 | 7.14 | 16.40% | Oct 2025 | 229,476 | 1.88 | 0.06 |
| North Macedonia | 1,813,790 | 6.89 | 15.90% | Oct 2025 | 221,615 | 3.80 | 0.12 |
| Tunisia | 12,348,600 | 6.84 | 9.40% | Oct 2025 | 219,998 | 0.55 | 0.02 |
| Oman | 5,542,042 | 6.73 | 4.50% | Mar 2025 | 216,297 | 1.21 | 0.04 |
| Latvia | 1,853,560 | 6.66 | 14.40% | Oct 2025 | 213,998 | 3.59 | 0.12 |
| Guinea | 15,099,700 | 6.29 | 51.10% | Nov 2024 | 202,335 | 0.42 | 0.01 |
| Lithuania | 2,830,140 | 5.82 | 10.60% | Oct 2025 | 186,999 | 2.06 | 0.07 |
| Colombia | 53,425,600 | 4.68 | 0.90% | Oct 2025 | 150,306 | 0.09 | 0.00 |
| Bahrain | 1,643,330 | 4.67 | 10.60% | Jul 2025 | 149,999 | 2.84 | 0.09 |
| Brunei Darussalam | 466,330 | 4.55 | 12.70% | Dec 2024 | 146,432 | 9.77 | 0.31 |
| Slovenia | 2,117,070 | 4.23 | 15.60% | Oct 2025 | 135,999 | 2.00 | 0.06 |
| Mozambique | 35,631,700 | 3.94 | 12.10% | Jul 2025 | 126,574 | 0.11 | 0.00 |
| Zimbabwe | 16,950,800 | 3.59 | 53.00% | Sep 2025 | 115,556 | 0.21 | 0.01 |
| Bosnia and Herzegovina | 3,140,100 | 3.48 | 4.80% | Mar 2025 | 111,999 | 1.11 | 0.04 |
| Albania | 2,771,510 | 3.42 | 5.20% | Sep 2025 | 109,999 | 1.23 | 0.04 |
| Aruba | 108,147 | 3.11 | 19.60% | Nov 2024 | 99,999 | 28.76 | 0.92 |
| Luxembourg | 680,453 | 2.24 | 9.60% | Oct 2025 | 71,999 | 3.29 | 0.11 |
| Hong Kong SAR | 7,396,080 | 2.08 | 0.10% | Sep 2025 | 66,999 | 0.28 | 0.01 |
| Iceland | 398,266 | 1.98 | 3.40% | Oct 2025 | 63,799 | 4.98 | 0.16 |
*Figures rounded
Data Source:
- World Gold Council
- London Bullion Market (LBMA), New York Stock Exchange (NYSE)
- World Population Review: Total Population by Country 2025
- U.S. Mint: American Eagle Coins
- International Monetary Fund
Methodology
To prepare this report, the team at BestBrokers used the most current data about official central banks’ gold reserves published by the World Gold Council. This is an international trade association for the gold industry, which collects gold holdings data from the International Monetary Fund, the Bank for International Settlements, central banks, and other sources. It should be noted, however, that certain countries are excluded from the database as they are known to have gold reserves but do not report it officially.
Another territory not to make it to our calculations is Curacao and Sint Maarten, which have 9.18 tonnes of gold as of December 2025. The WGC has combined data for the two Caribbean nations, but they are separate constituent countries of the Kingdom of the Netherlands, which is why we did not list them jointly.
For the per-capita gold reserve ranking, we used publicly available population estimates for 2025. We had to convert the tonnes of gold to troy ounces, so all calculations were based on a conversion rate of 32,150.70 ounces for 1 tonne. For the gold coins, we looked for a small coin and used the American Eagle Gold Proof Coin, 1/10 ounce as an example. It is a one-tenth-ounce coin with a $5 face value, which is 0.650 inches (16.50 mm) in diameter. The coin contains 0.1000 gold troy ounces and weighs 0.1091 troy ounces (3.393 g). It is minted in the United States but many other countries have similar coins.
Here are a few measurements and rates we used for the calculations:
- 1 tonne of gold = 32,150.70 gold troy ounces
- 1 tonne = 1,000,000 grams
- 1 gold troy ounce = 10 coins (1/10 ounce gold coin)